December 22, 2024

You’re the Boss Blog: Sorting Through the New Political Alignments in Small Business

The Agenda

How small-business issues are shaping politics and policy.

In a post for our colleagues at Economix on the divide between small and big — and local and global — businesses, Nancy Folbre, an economics professor, raises a number of issues important to You’re The Boss readers.

In particular, she discusses the emergence of several groups, mostly progressive, that claim to represent local and independent small businesses. They include membership organizations like the American Independent Business Association, the Main Street Alliance, Business Alliance for Local Living Economies, as well as the Small Business Majority and the American Sustainable Business Council, which have no members.

It’s an interesting list, in an interesting column. Ms. Folbre appears to find a connection between local and liberal, painting it in opposition to global interests represented by the U.S. Chamber of Commerce. “The resulting divergence in economic interests” between local and global companies, she writes, “is driving new political alignments.”

But is it? Among the issues she cites is the ability of states to collect sales taxes from online retailers that are based out of state, and in fact the Marketplace Fairness Act now seems likely to pass the Senate very soon. But Internet tax fairness, as its proponents call it, is not necessarily a battle between liberals and conservatives, although more conservatives tend to oppose it. One can support the Marketplace Fairness Act, or any number of measures intended to strengthen small, independent businesses, and still oppose, say, the Affordable Care Act or higher taxes on the wealthy. To complicate matters further, it’s not necessarily a local-versus-global issue either. Much of the backing for the Alliance for Main Street Fairness, the chief lobbying coalition for the Marketplace Fairness Act (and unrelated to the Main Street Alliance), has been supplied by national and international big-box retailers that are anathema on Main Street: Wal-Mart, Target, Best Buy and Home Depot, among others.

Perhaps the emergence of these groups simply reflects that liberal activists — and business owners — have styled themselves in a way that they hope taps into the way small businesses resonate with many Americans. As Ms. Folbre puts it, “We think of small-business owners as men and women who invest in their own communities, work in the same building as their employees, send their children to the same schools and walk their dogs in the same neighborhood parks.”

In any event, it may be a long time before these groups challenge the dominance of the conservative organizations. The groups she lists are all very small compared to the National Federation of Independent Business, which has 350,000 members, or the Chamber of Commerce, which has nearly three million small-business members, despite its often national and international orientation. (Many of those businesses — the Chamber declines to say how many — are actually members of state or local affiliates and may not necessarily buy into the Chamber’s politics. Indeed, Ms. Folbre notes that nearly 60 local chambers have withdrawn from the national organization.)

We’d like to hear from readers who have heard from some these new organizations. How did you find out about them? Did you join? Why or why not?

Article source: http://boss.blogs.nytimes.com/2013/05/06/sorting-through-the-new-political-alignments-in-small-business/?partner=rss&emc=rss

Economix Blog: Uwe E. Reinhardt: How Medicare Is Misrepresented

DESCRIPTION

Uwe E. Reinhardt is an economics professor at Princeton. He has some financial interests in the health care field.

A common phrase in the current debate over the so-called fiscal cliff is “Medicare needs to be restructured.” The term serves as code for policies unlikely to be appealing to voters, a term that can mean everything and, thus, nothing.

Today’s Economist

Perspectives from expert contributors.

The question is what problem restructuring is to solve in traditional Medicare, which remains one of the most popular health insurance programs in this country. People who use this vague term should always be challenged to explain exactly why and how Medicare should be changed.

Critics of traditional Medicare – even those who should know better – often accuse it of being “fee for service.” It is a strange accusation. After all, fee-for-service remains the dominant method of paying the providers of health care under private insurance, including Medicare Advantage, the option of private coverage open to all Medicare beneficiaries.

Describing Medicare as fee-for-service insurance is about as thoughtful as describing a horse as “an animal that has four legs,” a characteristic shared by many other animals. The practice is particularly odd, given that traditional Medicare as early as the 1970s was the first program to develop so-called “bundled payments” for hospital inpatient care – the diagnostically related groupings, known as D.R.G. – in place of fee-for-service payment of hospitals, an innovation that has since been copied around the globe.

A more descriptive term for traditional Medicare would be “free choice of providers” or “unmanaged care” insurance. These features, of course, would hardly be viewed as shortcomings among people covered by traditional Medicare or their families. Neither term would be a good marketing tool among voters for proposals to abandon traditional Medicare.

In this regard, it may be helpful to list the various contractual relationships that can exist between the insured and insurers, on the one hand, and the various methods of paying the providers of care, on the other:

Indemnity Insurance: This is the oldest form of health insurance. It offers the insured free choice of health care provider and of treatment, which is why such policies tend to be expensive.

Under indemnity insurance, providers of care are typically paid on a fee-for-service basis. Insurers usually pay a stipulated fraction (say 80 percent) of the providers’ bills for covered services. Patients absorb the rest in the form of deductibles and coinsurance (e.g., 20 percent of the providers’ bill). Under some policies, insurers ask patients to pay providers first and then seek reimbursement from the insurer.

Managed-Care Contracts: The other three insurance contracts shown in the display – H.M.O., P.P.O. and P.O.S. contracts – are generally lumped together under the generic term “managed care.” It is another ill-defined term that can mean a host of specific limitations on the insured’s freedom of choice.

Doctors may assert that it is they who manage the medical treatments. But in health-policy circles, the term managed care means that the doctor’s medical treatments are subject to external constraints imposed by a private regulator — the patient’s health insurer — although, in principle, public insurers could “manage” care as well, if legislators permitted it.

These externally imposed constraints may take the form of formularies for prescription drugs or prior authorization by the insurer for specific procedures – e.g., expensive imaging or elective surgery – before the insurer agrees to pay for the procedures. They may mean exclusion from coverage of procedures deemed by the insurer to have a low expected benefit-cost ratio. While Congress forbids Medicare to let cost-benefit analysis guide its coverage decisions, private insurers are not subject to that constraint.

Finally, managed care techniques might include the external coordination of medical treatments that involved multiple providers of health care, especially the treatment of chronic disease, often by subcontracted companies specializing in care coordination.

These are the major forms of managed care insurance contracts.

Health Maintenance Organizations (H.M.O.): These contracts represent the most restrictive form of managed care. The insurer provides covered health care benefits through a network of health care providers under contract to the insurer, with zero or very modest cost-sharing at point of service on the part of the insured.

In a staff model H.M.O., the insurer actually owns the health care facilities and health professionals are the insurer’s salaried employees. More commonly, the H.M.O. merely contracts with a set of otherwise independent providers that are paid negotiated fees or, for primary care, sometimes annual capitation payments per patient on the doctor’s list.

Usually, in an H.M.O., the insured is asked to select one from a roster of primary-care doctors who regulates referrals to specialists. In principle, under an H.M.O. contract the insured is confined to the H.M.O.’s network of providers for covered services and pays in full out-of-pocket for health care procured outside that network.

Preferred Provider Organizations (P.P.O.): A popular alternative to the strictly limited choice under H.M.O.’s is a Preferred Provider Organization. Under that contract, the insurer negotiates prices with a network of “preferred” providers of care and the insured can contact specialists without a required referral by a primary-care doctor.

For the most part these providers in the network are paid on a fee-for-service basis as well, often X times the Medicare fee schedule, where X could be smaller than 1 but usually exceeds 1, where X is negotiated between the insurer and providers. The insured usually faces an annual deductible and relatively modest copays (dollar amounts, not fractions of the fees) if they obtain care from a provider in the network.

If the insured obtains care from a provider outside the P.P.O.’s network, the insurer will reimburse the insured only at what the insurer considers a reasonable fee, leaving the insured to pay any billed fee above that reimbursement. According to a report by the American Health Insurance Plans, these out-of-network fees can be exorbitantly high, which serves as a natural constraint on the free choice of provider under P.P.O.’s.

Point of Service (P.O.S.) Contracts: These contracts are combinations of H.M.O. and P.P.O. contracts. The insured still must select a primary-care doctor who coordinates the insured’s overall medical care, but patients can procure covered care from providers outside the H.M.O.’s network, albeit at high rates of cost-sharing. In that regard the arrangement resembles a P.P.O.

High-Deductible Health Plans (H.D.H.P.): These contracts couple indemnity- or preferred-provider (P.P.O.) insurance with very high annual deductibles, sometimes exceeding $10,000 for a family. The theory is that by putting the insured’s skin in the game, these plans will give patients an incentive to shop around for cost-effective health care. Some call them “Consumer-Directed Health Plans” (C.D.H.P.’s), because in theory they elevate “consumers” (formerly “patients”) to act as the chief managers of their own health care. However, the requisite information for shopping around has not generally been available to patients, forcing them to function in health care as would blindfolded shoppers in a department store.

What the critics of traditional, government-run Medicare actually find wanting in traditional Medicare is that it basically is classic indemnity insurance. It offers its enrollees free choice of doctor, hospital and other providers, and doctors relatively free choice of treatments, while most private insurers typically no longer do.

In other words, the complaint is that health care rendered under traditional Medicare is unmanaged care. These features, of course, are precisely the reason why in the eyes of the public traditional Medicare is still one of the most popular insurance products.

A case can be made, on theoretical and sometimes empirical grounds, that properly managed or coordinated care can on average yield superior medical treatments, at lower cost, than completely unmanaged care under classical indemnity insurance.

The problem has been and continues to be that this is not the folklore among patients or doctors. The latter, as noted, generally believe they can manage their patients’ care properly without outside interference into their clinical decisions. Among patients and doctors, the term managed care is still not quite respectable.

This can explain why critics of traditional Medicare delicately but nonsensically prefer to decry it as being fee for service rather than as free-choice-of-providers insurance or unmanaged-care insurance.

Article source: http://economix.blogs.nytimes.com/2012/12/07/how-medicare-is-misrepresented/?partner=rss&emc=rss

Economix Blog: Q. and A. on Forecasting Based on Voter Expectations

A new academic study concludes that poll questions about expectations  – which ask people whom they think will win – have historically been better guides to the outcome of presidential elections than traditional questions about people’s preferences. From my article about the study, by David Rothschild and Justin Wolfers, and the reaction to it:

Most recently, Mitt Romney won the Republican nomination despite at various points trailing other candidates — Rick Santorum, Newt Gingrich, Herman Cain, Rick Perry — in polls of Republican voters’ preferences. Even when Mr. Romney was behind, Republicans typically told pollsters that they expected him to win the nomination….

In presidential races since 1952, the expectations question has pointed to the winner in 81 percent of states, based on data from the American National Election Studies. The question about voting intentions pointed to the winner in 69 percent.

Below is a lightly edited interview with Mr. Wolfers, conducted by e-mail, focusing on the implications of the study for current presidential polls.

In the article, I discussed only briefly the expectations polls about the 2012 race, and some of the Twitter feedback was eager for more. By my count, there have been five recent major polls asking people whom they expect to win — by ABC/Washington Post, Gallup, Politico/George Washington University, New York Times/CBS News, and the University of Connecticut. There is also sixth from Rand asking people the percentage chances they place on each candidate winning. How consistent are the polls?

There’s a striking consistency in how people are responding to these polls. The most recent data are from the Gallup poll conducted Oct. 27-28, and they found 54 percent of adults expect Obama to win, versus 34 percent for Romney. Around the same time (Oct. 25-28), there was a comparable New York Times/CBS poll in which 51 percent of likely voters expect Obama to win, versus 34 percent for Romney.

But these results aren’t just stable across pollsters, they’ve also been quite stable over the past few weeks, even as the race appeared to tighten for a while. Politico and George Washington University ran a poll of likely voters on Oct. 22-25, finding 54 percent expect Obama to win, versus 36 percent for Romney. The University of Connecticut/Hartford Courant poll of likely voters got a somewhat higher share not venturing an answer, with 47 percent expecting Obama to win versus 33 percent for Romney. Finally, the ABC/Washington Post poll of registered voters run Oct. 10-13 found 56 percent expect Obama to win, compared to 35 percent for Romney.

I’m rather surprised by the similarities here – across time, across pollsters, across how they word the question, and across different survey populations (likely voters, registered voters, or adults) – but I suspect that is part of the nature of the question. You just don’t see the noise here that you see in the barrage of polls of voter intentions, which are extremely sensitive to all of these factors.

I always throw out the folks who don’t have an opinion, and count the proportions as a share of only those who have an opinion. By this measure, the proportion who expect Obama to win is: 61 percent (Gallup), 60 percent (The New York Times), 60 percent (Politico), 59 percent (Hartford Courant), 62 percent (ABC). The corresponding proportions who expect Romney to win are: 39 percent, 40 percent, 40 percent, 41 percent and 38 percent. Taking an average across all these polls: 60.3 percent expect Obama to win. Or if you prefer that I focus only on the freshest two polls, 60.7 percent expect him to win.

The results do seem have tightened somewhat since the first debate, which Romney was widely seen to have won, right? Do the patterns — or lack of patterns — in the numbers help solve the issue of what most people are thinking of when they answer the expectation question: Private information (their friends’ voting plans, yard signs in their neighborhood, etc.) or public information (media coverage, speeches, etc.)?

The results of the polls of voter intentions seem to have tightened a bit since the first debate. There’s an interesting school of thought in political science that basically says: voters are pretty predictable. But they don’t think too hard about how they’re going to vote until right before the election. So what happens is that public opinion through time just converges to where it “should” be. And viewed through this lens, the first debate was just an opportunity for people who really should always have been in Romney’s camp to figure out that they’re in Romney’s camp.

So why did the expectations polls move less sharply than intentions polls? One possibility is that your expectations are explicitly forward-looking, and perhaps people saw the race tightening as they saw that some of the support for Obama was a bit soft. Let me put this another way: There are two problems with how we usually ask folks how they plan to vote. First, the question captures the state of public opinion today, while the expectations question effectively asks you where you think public opinion is going. And second, polls typically demand a yes or no answer, when the reality may be that we know that our support is pretty weak, and it may change, or we aren’t even sure whether we’ll turn up to the polls. The virtue of asking about expectations is that you can think about each of your friends, and think not just about who they’re supporting today, but also whether they may change their minds in the future.

I worry that it sounds a bit like I haven’t answered your question, but that’s because I don’t have a super-sharp answer. If I had to summarize, it would be: expectations questions allow you to think about how the dynamics of the race may change, and so they are less sensitive to that change when it happens.

Based on your research and the current polls, what does the expectations question suggest is the most likely outcome on Tuesday?

If a majority expects Obama to win, then right there, it says that I’m forecasting an Obama victory.

But by how much? Here’s where it gets tricky. The fact that 60 percent of people think that Obama is going to win doesn’t mean that he’s going to win 60 percent of the votes. And it doesn’t mean that he’s a 60 percent chance to win. Rather, it simply says that given the information they have, 60 percent of people believe that Obama is going to win. Can we use this to say anything about his likely winning margin?

Yes. I’ll spare you the details of the calculation, but it says that if 60.3 percent of people expect Obama to beat Romney, then we can forecast that he’ll win about 52.5 percent of the two-party vote. That would be a solid win, though not as impressive as his seven-point win in 2008.

The proportion who expect Obama to win right now looks awfully similar to the proportion who expected George W. Bush to win in a Gallup Poll at a similar point in 2004. Ultimately Bush won 51.2 percent of the two-party vote.

Right now, Nate Silver is predicting that Obama will win 50.5 percent of the popular vote, and Romney 48.6 percent. As a share of the two-party vote, this says he’s forecasting Obama to win 51 percent of the vote. Now Silver’s approach aggregates responses from hundreds of thousands of survey respondents, while I have far fewer, so his estimate still deserves a lot of respect. I don’t want to overstate the confidence with which I’m stating my forecast. So let me put it this way: My approach says that it’s likely that Obama will outperform the forecasts of poll-based analysts like Silver.

We’ll find out soon enough. Thanks.

Article source: http://economix.blogs.nytimes.com/2012/11/02/forecasting-based-on-expectations-not-intentions/?partner=rss&emc=rss

Economix Blog: Bruce Bartlett: Republicans Champion ‘Voluntary Taxes’

DESCRIPTION

Bruce Bartlett held senior policy roles in the Reagan and George H.W. Bush administrations and served on the staffs of Representatives Jack Kemp and Ron Paul. He is the author of “The Benefit and the Burden: Tax Reform — Why We Need It and What It Will Take.”

The Republican-controlled House of Representatives took a break last week from doing nothing to pass a bill to facilitate voluntary taxation. Almost simultaneously, Mitt Romney released his final tax return for 2011, showing that he voluntarily overpaid his taxes by taking less of a deduction for his charitable contributions than he was permitted.

Today’s Economist

Perspectives from expert contributors.

The legislation was H.R. 6410, “The Buffett Rule Act of 2012.” Those not acquainted with the misleading titles often given to Congressional bills might at first glance think this one has something to do with raising taxes on the ultrawealthy.

Of course, Republicans would never actually raise taxes on the ultrawealthy; they think, or at least assert publicly, that the deficit results from too many poor people not paying taxes. But it would be very helpful to them to have a fig leaf that looks as if they had found a way of getting the rich to pay more. That is by encouraging them to voluntarily pay more, as Mr. Romney did.

Named for the billionaire Warren Buffett, what came to be known as the “Buffett rule” is a proposal by Democrats that all those with incomes of $1 million or more pay at least 30 percent of their income in federal income taxes.

Mr. Romney and his wife had an effective federal income tax rate of just 14 percent, including the voluntary overpayment, on incomes over $13 million in each of the years 2010 and 2011, the only ones for which they have released tax returns.

In April, Senate Republicans filibustered an effort by Democrats to enact a real Buffett rule. Thus there was no chance that Congress would actually legislate higher taxes on the wealthy this year. But apparently, House Republicans feel pressured by voters to respond to the low effective tax rates that many rich people pay, which contribute significantly to historically low federal revenues as a share of the gross domestic product and, hence, to the deficit and the debt.

Republicans recognize that the Buffett rule is politically popular. An April Gallup poll found that Americans favor the Buffett rule by 60 percent to 37 percent, an Ipsos/Reuters poll in March found people supporting it by 64 percent to 30 percent, and a February Associated Press/GfK poll found 65 percent in favor of the Buffett rule and only 26 percent opposed.

H.R. 6410, which was introduced on Sept. 14 and passed the House by voice vote on Sept. 19 with no hearings and just a few minutes of debate, would allow taxpayers to designate on their tax returns a contribution to the federal government, over and above their tax liability, for deficit reduction. Of course, the Treasury has had a fund since 1843 to accept gifts, so the new legislation doesn’t really do anything. So far this year, $7.6 million has been donated.

Representative Chris Van Hollen, Democrat of Maryland, characterized the Republican legislation as a “pretty please” bill. As he put it, “Pretty please, Warren Buffett, pretty please, Mitt Romney, won’t you help contribute a little bit more toward reducing our deficit?”

One could perhaps take the Republican proposal more seriously if it also required a statement on application forms for Social Security and Medicare that those qualified should consider voluntarily forgoing benefits to reduce the deficit. The forms that farmers use to apply for agricultural subsidies could suggest that they put deficit reduction ahead of their personal interest, and so on.

The political reality is that Republicans don’t really support taxation at any level. Of course, none will go on the record saying that they favor abolition of all taxation; they just support every single tax cut and oppose every single tax increase. I have not heard any Republican in recent years acknowledge that the deficit results in any way from lower revenues; rather, they say, the deficit is caused only by excessive spending on everything except the military. Implicitly, therefore, the only kind of taxation a Republican can support is voluntary taxation.

Extreme libertarians, such as the novelist Ayn Rand, have long held that this is the only legitimate form of taxation. As she wrote in a 1964 essay reprinted in her book “The Virtue of Selfishness”:

In a fully free society, taxation – or, to be exact, payment for government services – would be voluntary. Since the proper services of a government – the police, the armed forces, the law courts – are demonstrably needed by individual citizens and affect their interests directly, the citizens would (and should) be willing to pay for such services, as they pay for insurance.

As we know, the Republican vice-presidential nominee Paul D. Ryan has expressed admiration for Rand’s views, and many Republicans in Congress, influenced by the Tea Party movement, support abolition of important government programs along with more tax cuts for the rich.

Interestingly, there actually are instances of voluntary taxation. The New York Times reports that the mayor of Bogotá, Colombia, once asked his citizens to voluntarily pay more taxes and 63,000 of them did. The Times has also reported that cities now often ask tax-exempt organizations to make voluntary payments in lieu of taxes and are turning to parents groups to fill holes in school funding and to community groups to take over park maintenance and other tasks.

Other examples of voluntary methods of financing governmental services include the bond drives of World War II, lotteries, tontines and political campaign contributions. Public universities often solicit private funds to pay for new buildings or programs and remittances by migrants living abroad are a kind of private foreign aid. And of course private charities often engage in social welfare, as well as providing facilities like hospitals and museums (some of which are also provided by government).

While there is no doubt that there are creative methods by which local governments might be able to raise additional revenue and encourage the private sector to take over some of their responsibilities, there is little, if any, scope for this by the federal government. Too much of what it does falls into the category of pure public goods that government must provide, like national defense, or entitlement programs like Social Security and Medicare.

Realistically, voluntary taxation is not a viable alternative to broad-based taxes. Those who oppose raising taxes on the wealthy and are concerned about the number of people exempt from federal income taxes ought to consider a national sales tax, as every other major country has. As Alexander Hamilton explained in Federalist 21, one virtue of consumption taxes is that they are to some extent voluntary.

Article source: http://economix.blogs.nytimes.com/2012/09/25/republicans-champion-voluntary-taxes/?partner=rss&emc=rss

Economix Blog: New York State Leads in Income Inequality

CATHERINE RAMPELL

CATHERINE RAMPELL

Dollars to doughnuts.

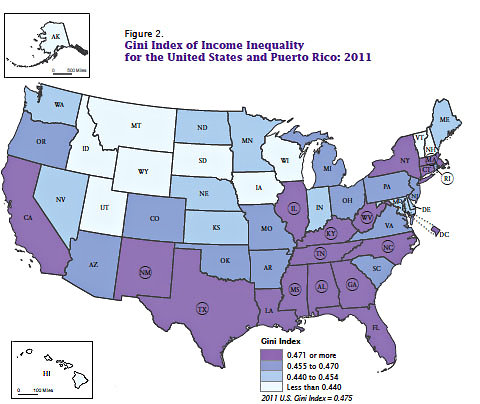
Of all American states, New York again has the most unequal income distribution, according to a new report from the Census Bureau. Wyoming has the most equitably distributed income.

Source: U.S. Census Bureau, 2011 American Community Survey. A state abbreviation surrounded by a circle  denotes the value for the state is not statistically different from the overall country's Gini index.Source: U.S. Census Bureau, 2011 American Community Survey. A state abbreviation surrounded by a circle  denotes the value for the state is not statistically different from the overall country’s Gini index.

Income inequality is measured by the Gini index, which runs from zero to one. A zero represents a society where income is distributed exactly proportionally among every household. A one indicates maximum inequality, where one household has all the income and all the others have none.

The Gini index value for the United States in 2011 was 0.475, higher than it was in 2010 at 0.469. The index rose in 20 states last year (including New York); there was no statistically significant change in the rest of the states and the District of Columbia (which, at 0.534, has a higher index value than any state).

The Gini index value for New York State was 0.503, which means the state’s household incomes are about as equally distributed as those in Costa Rica, at least according to the most recent international data available.

The report also looked at median household incomes across the states, which showed great inequality among states as well as within them. The median household income ranged from a low of $36,919 in Mississippi to a high of $70,004 in Maryland.

As previously reported, the national median income fell from 2010 to 2011. There was only one state in which it rose a statistically significant amount, after adjusting for inflation: Vermont, where the median household income was $52,776 in 2011 after having been $50,707 in 2010.

Article source: http://economix.blogs.nytimes.com/2012/09/20/new-york-state-leads-in-income-inequality/?partner=rss&emc=rss

Economix Blog: Casey B. Mulligan: Changes in Inequality the 21st Century

DESCRIPTION

Casey B. Mulligan is an economics professor at the University of Chicago.

A couple of important measures of labor-market inequality have played out since 2008 much the way they did previously.

Today’s Economist

Perspectives from expert contributors.

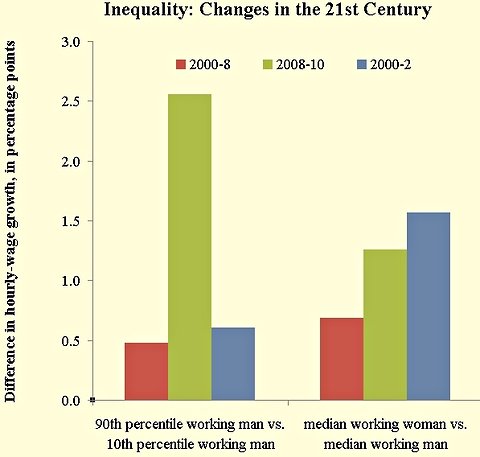
One measure of changing inequality in the labor market, commonly used by economists, is the annualized 90-10 change: the annualized growth rate of wages at the 90th percentile of the distribution of wages for men working full time minus the growth rate of wages at the 10th percentile of the same distribution.

Because the 90th percentile wage is the wage below which 90 percent of working men earn, the annualized 90-10 change can be interpreted as the degree to which the wages of high-earning men grow more, or fall less, than the wages of low-earning men. The measure can in principle be negative, in which case the wages of less-skilled people would be partly catching up with the wages of skilled people.

I measured these changes using the Census Bureau’s Current Population Survey Merged Outgoing Rotation Group sample. (Analysis of wage patterns is often performed with the Census Bureau surveys, although most of them lack information on employee fringe benefits over and above wages and salaries.) The left part of the chart below shows the annualized 90-10 change over three time periods.

The first time period is 2000-8, the years of George W. Bush presidency, and the years before the 2009 depths of the “Great Recession.” Wages grew faster for high-skill people during these years: about 0.5 percentage points a year extra (roughly a cumulative four extra percentage points for the entire period).

Wages also grew faster for high-skill people between 2008 and 2010 (the last year for which I have data). The average growth differential between them and low-skill people was a whopping 2.6 percentage points a year.

One interpretation of these results is that the rewards for accumulating skill have been increasing over time, especially in the last two years. The more common and less euphemistic interpretation is that the rich have been getting richer, especially recently.

Perhaps the Great Recession of 2008-9 and slow recovery is to blame for all of this. For this reason, I looked separately at the recession period 2000-2. That recession (0.6 extra percentage points a year) looks a lot like the longer 2000-8 period (0.5 extra percentage points a year).

Another indicator of inequality is wage equality between the genders. The right part of chart shows changes in gender wage equality. The gender measures are positive if and when wages grow faster for women than for men and negative if and when male wages grow faster. The former is usually viewed as progress, because for centuries women have been earning less than men.

During the George W. Bush presidency (and a number of the presidencies before him), wages grew more for women than for men, about seven-tenths of one percentage a year more on an annual basis. During the first two years of the Obama presidency (or, if you want, during the Great Recession), the gender wage gap closed even more rapidly (1.3 percentage points a year), though less rapidly than it did in during the previous recession (1.6 percentage points a year).

President Obama is sometimes likened to Lyndon B. Johnson or Jimmy Carter, but theirs were not years when high-skill people were gaining ground at a faster pace than low-skill people and not years when women’s wages were catching up to men’s. When it comes to measures of labor-market inequality, the last few years so far look at lot like the years before 2008.

Perhaps that shows how Presidents Bush and Obama are not so different in their economic policies, or that presidents have little impact on important economic trends.

Article source: http://economix.blogs.nytimes.com/2012/09/12/changes-in-inequality-the-21st-century/?partner=rss&emc=rss

Economix Blog: Bruce Bartlett: Mitt Romney, Carried Interest and Capital Gains

DESCRIPTION

Bruce Bartlett held senior policy roles in the Reagan and George H.W. Bush administrations and served on the staffs of Representatives Jack Kemp and Ron Paul. He is the author of “The Benefit and the Burden: Tax Reform – Why We Need It and What It Will Take.”

The issue of Mitt Romney’s taxes continues to be a political liability for him. A NBC News/Wall Street Journal poll last month found that 36 percent of registered voters have a more negative opinion of him because of the issue, up from 27 percent in January, compared with 6 percent who have a more positive view.

Today’s Economist

Perspectives from expert contributors.

As I have discussed previously, the two years of returns Mr. Romney has been willing to release, for 2010 and 2011, show that he paid much lower effective federal income tax rates in both years than his running mate, Representative Paul D. Ryan, whose income was 85 percent to 90 percent lower than Mr. Romney’s in those years.

A key reason for Mr. Romney’s low tax rate is that a very substantial amount of his income comes from capital gains – 51 percent in 2011 and 58 percent in 2010. Capital gains, no matter how large, are taxed at a maximum rate of 15 percent, whereas wage income can be taxed as much as 35 percent by the income tax plus taxes for Medicare and Social Security. The latter two are not assessed on capital gains.

Significantly, much of Mr. Romney’s capital gains income achieved this treatment through a special tax loophole called carried interest. According to recently released documents, executives at Bain Capital, where Mr. Romney made the bulk of his estimated $250 million fortune, saved $200 million in federal income taxes and another $20 million in Medicare taxes because of the carried interest loophole.

The way the loophole works relates to the peculiar method in which money managers are compensated. Typically, they receive a fee of 2 percent of the gross assets under management, much of which comes from employee pension funds, plus 20 percent of any increase in value.

Thus, on $1 billion of assets the managers would automatically get $20 million that would be taxed as ordinary income. If the assets increased 10 percent to $1.1 billion, they would get another $20 million. For tax purposes, this additional $20 million would be treated as a capital gain and taxed at 15 percent.

The theory is that the money managers effectively become part owners of the assets they manage as a result of the fee structure. Critics contend that the distinction between the 2 percent and 20 percent fees is purely artificial — that in reality all their compensation should be treated as ordinary income and taxed as such.

Among the sharpest critics of carried interest is Victor Fleischer, a law professor at the University of Colorado. In a Sept. 4 post on DealBook, he explains that the New York attorney general’s office is looking into the issue, seeking to determine whether money managers have been illegally converting their 2 percent management fees into lower-taxed capital gains.

The New York Times recently commented in an editorial that while the carried interest loophole is unjustified, the core problem is lower tax rates on capital gains generally. Said The Times, “As long as income from investments is taxed at a lower rate than income from work, there will be no stopping the search for ways, legal or otherwise, to pay the lower rate.”

The view that capital gains should be treated as ordinary income for tax purposes is one that is widely shared by liberal tax reformers. They got their wish, briefly, from 1987 to 1990 because Ronald Reagan agreed to raise the tax rate on capital gains to 28 percent from 20 percent in return for a reduction in the top rate on ordinary income to 28 percent from 50 percent, as part of the Tax Reform Act of 1986.

There are three big problems, however, with taxing capital gains at the same rate as ordinary income. First, even if that were the case, capital gains would still be treated more beneficially, because the taxes only apply to realized gains. Those that are unrealized would remain untaxed. Investors needing cash could simply borrow against their assets to minimize their taxes, rather than selling and realizing a capital gain.

To equalize the taxation of capital gains and ordinary income, it would be necessary to tax unrealized gains. In theory, all increases in net wealth should be taxed annually, according to the economists Robert M. Haig and Henry C. Simons. But a 1920 Supreme Court case, Eisner v. Macomber, held that only realized gains could be taxed.

As long as a taxpayer decides when or if to realize gains for tax purposes, that is a very valuable loophole even if gains are taxed at the same rate as ordinary income. For one thing, a taxpayer can easily match gains with losses to avoid having net taxable gains. And, of course, capital gains would still avoid the 15.3 percent payroll tax, which applies only to wage income.

Second, there is a problem with inflation insofar as capital gains are concerned. Many academic studies have shown that a considerable portion of realized capital gains simply represent inflation, rather than real increases in purchasing power.

While theoretically capital gains could be indexed for inflation, it would be very complicated. For one thing, it is not clear what the appropriate price index should be. For another, there is the problem of also indexing losses. Historically, Congress has felt that simply excluding a certain percentage of capital gains from taxation was a better way to compensate for inflation.

Third, it is a fact of life that those with great wealth are the principal beneficiaries of the capital gains tax preference, and they exercise influence in our political system far out of proportion to their numbers. They will pressure both parties relentlessly to restore a lower tax rate on capital gains and eventually they will be successful. Keep in mind that two Democratic presidents, Jimmy Carter and Bill Clinton, signed cuts in the capital gains rate into law.

In short, it is a pipe dream to believe that eliminating the capital gains preference is the key to fixing the carried interest loophole. It can and should be addressed by treating carried interest as ordinary income, without requiring that all capital gains be taxed as ordinary income.

Article source: http://economix.blogs.nytimes.com/2012/09/11/mitt-romney-carried-interest-and-capital-gains/?partner=rss&emc=rss

Economix Blog: Wealth, Taxes and Public Opinion

CATHERINE RAMPELL

CATHERINE RAMPELL

Dollars to doughnuts.

Last week I wrote about a new Pew Research Center report on the ailing middle class. Today, Pew has come out with a comparable report about the wealthy and how Americans feel about this upper-income class.

When respondents were asked how much a family of four would need to earn to be considered wealthy “in your area,” the median response was $150,000. The responses varied by geographic region, though, with people in the Northeast (where the cost of living is higher) giving a median response of $200,000.

The survey also included a pointed question about whether upper-income people pay their “fair share” in taxes. About 26 percent of respondents said they did, with another 8 percent saying the rich paid too much in taxes and 58 percent saying the rich paid too little.

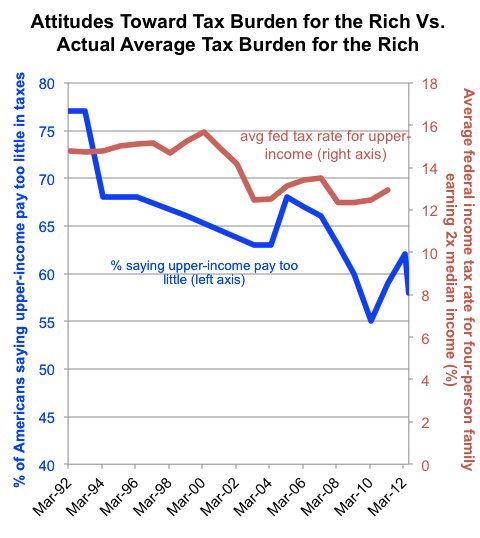
If that sounds like a lot of people complaining that the wealthy don’t contribute enough to Uncle Sam, note that Americans’ attitudes toward the tax obligation of the rich have become much less demanding over the last two decades.

When this question was first asked by Gallup, in March 1992, 77 percent of respondents said upper-income Americans paid too little in taxes. Yet the average income tax burden of the wealthy was actually higher then.

Sources: Pew Research Center, Tax Policy Center. The blue line, which shows the percent of Americans who say the upper-income pay too little in taxes, refers to the left-hand axis. Note that this axis does not start at zero to better show the change. The red line, which shows the average federal income tax rate for a family of four earning twice the median income, refers to the right-hand axis.Sources: Pew Research Center, Tax Policy Center. The blue line, which shows the percent of Americans who say the upper-income pay too little in taxes, refers to the left-hand axis. Note that this axis does not start at zero to better show the change. The red line, which shows the average federal income tax rate for a family of four earning twice the median income, refers to the right-hand axis.


In 1992, when more than three-quarters of Americans said that rich people should be paying more, a family of four earning twice the median household income paid an average federal income tax rate of 14.79 percent, according to the Tax Policy Center.

As of 2011, the average tax burden for a family of four earning twice the median income (which came to $151,296) was 12.93 percent.

Over the same period, Americans have become much more demanding about how much the poor pay, however.

In 1992, 8 percent of Americans said lower-income people paid “too little” in taxes. Today that share has risen to 20 percent.

As with that of the wealthy, the tax burden of the poor has also fallen considerably in the last two decades; in 1992, a family earning half the median income paid an average tax rate of 4.55 percent, whereas last year a family in that position had a negative tax burden of 6.84 percent (that is, the family received money from the federal government equaling 6.84 percent of their income, thanks to refundable tax credits).

For whatever reason, Americans have become much less tolerant of lower tax rates for the poor than they have for the rich.

Addendum on methodology: Pew’s survey was done through telephone interviews conducted July 16-26, 2012, with a nationally representative sample of 2,508 adults ages 18 and older. The margin of sampling error is plus or minus 3 percentage points.

Article source: http://economix.blogs.nytimes.com/2012/08/27/wealth-taxes-and-public-opinion/?partner=rss&emc=rss

Economix Blog: Keynes on Austerity and Extremism

John Maynard Keynes, the economist, resigned in 1918 from the Allied team imposing crippling reparations on Germany, warning that deliberately impoverishing a country would encourage extreme political movements that might provoke a second world war. The leaders of Germany and France run similar risks today, writes Nicholas Wapshot, the author of “‘Keynes Hayek: The Clash That Defined Modern Economics,” in a post on The International Herald Tribune’s Rendezvous blog. Read more »

Article source: http://feeds.nytimes.com/click.phdo?i=c680aab11bc9275dece4573c8162e60f

Economix Blog: Buffett vs. Mankiw on Taxes

DAVID LEONHARDT

DAVID LEONHARDT

Thoughts on the economic scene.

By inviting Debbie Bosanek, Warren Buffett’s secretary, to sit in the first lady’s box at the State of the Union address, President Obama has signaled that he intends to talk about the tax rate on some investments. Mr. Obama and Mr. Buffett both argue that many investment managers pay too little tax, because the tax code treats their pay as an investment return — and thus taxes it at a much lower rate than ordinary income. Mr. Buffett has famously said that, as a result, his secretary pays a higher tax rate than he does.

The tax rate on many investment gains is 15 percent, while the top tax rate on ordinary income is 35 percent.

This gap goes a long way toward explaining why Mitt Romney, the Republican presidential candidate, pays a lower tax rate than many affluent Americans.

N. Gregory Mankiw, a Harvard economist and former adviser to President George W. Bush who is now advising Mr. Romney, has questioned the notion that Mr. Buffett actually pays a higher tax rate than his secretary. Writing in The New York Times in 2007, Mr. Mankiw, who is a contributor to the “Economic View” column in The Times’s Sunday Business section, argued:

Another piece of the puzzle is that Mr. Buffett’s tax burden is larger than it first appears, because he is a major shareholder in Berkshire Hathaway.

When the [Congressional Budget Office] studies the tax burden, it includes all federal taxes, including individual income taxes, payroll taxes and corporate income taxes. In its analysis, payroll taxes are borne by workers, and corporate taxes by the owners of capital. For the richest 1 percent of the population, 9.3 percentage points of their 31.1 percent tax rate comes from the taxes that corporations have paid on their behalf. The corporate tax would undoubtedly loom large if the C.B.O. were to calculate Mr. Buffett’s effective tax rate.

Mr. Mankiw’s main point is that Mr. Buffett’s true tax rate is higher than he says, because he is effectively paying corporate taxes, through his ownership stake in companies.

We invited the Center on Budget and Policy Priorities, a liberal-leaning research group in Washington, to respond to Mr. Mankiw’s argument. Chuck Marr, the center’s director of federal tax policy, wrote in an e-mail message:

Professor Mankiw identifies the best source of information on this subject: the Congressional Budget Office. Let’s take a closer look, though, at the story that the latest numbers tell. They show a country in the midst of a stunning increase in inequality, with incomes at the top rising more than ten times as fast as the incomes of middle-class Americans. At the same time, taxes have been cut dramatically for the richest people in the country – one reason why deficits have gone up in recent years. The 29.5 percent average tax rate faced by the top 1 percent used to be 37 percent in 1979.

The result is that the share of after-tax income flowing to the top 1 percent has surged from 7.5 percent in 1979 to 17 percent. This represents a shift upward of hundreds of billions of dollars each year. With huge budget deficits on the horizon and working and middle-class families struggling, it is time to reverse course and return the tax burden at the top to more reasonable levels.

Look for more discussion of this issue on both Mr. Mankiw’s blog and the center’s blog. And The Times’s Caucus blog will be following the State of the Union address all night.

Article source: http://feeds.nytimes.com/click.phdo?i=b4b27135fd5d38c24260418233346e19