April 19, 2024

Median Income Rises, but Is Still 6% Below Level at Start of Recession in ’07

The study, issued on Wednesday by two former Census Bureau officials, suggests why many people remain glum even though the economy is growing and unemployment has declined.

Although median annual household income rose to $52,100 in June, from its recent inflation-adjusted trough of $50,700 in August 2011, it remained $2,400 lower — a 4.4 percent decline — than in June 2009, when the recession ended. This drop, combined with the 1.8 percent decline that occurred during the recession, leaves median household income 6.1 percent — or $3,400 — below its level in December 2007, when the economic slump began.

Since the end of the recession, the study said, household income has declined for all but a few population groups. Some of the largest percentage declines occurred for groups whose income was already well below the median, like African-Americans, Southerners, people who did not attend college, and households headed by people under age 25.

“Groups with low incomes tended to have steeper declines in income,” said Gordon W. Green Jr., who wrote the report with John F. Coder, a colleague at Sentier Research, which specializes in analyzing household economic data.

Households headed by people ages 65 to 74 were the only group in the study that experienced a statistically significant increase in post-recession income, helped perhaps by the decision of some older workers to remain in the work force or re-enter it.

The figures, adjusted for changes in the cost of living over time, include income before taxes and exclude capital gains. The number of households with income above the median is the same as the number below it.

The data offers a potential preview of the official Census Bureau statistics on income and poverty for 2012, scheduled to be released next month. The Sentier data is based on the Current Population Survey, a monthly government survey of about 50,000 households. The researchers used the same definition of income as the Census Bureau uses in its annual report on income and poverty. The two sets of estimates have shown broadly similar trends in recent years.

Because recessions rarely match up with calendar years, the annual census data often does not allow for precise comparisons with the start and end of downturns. The most recent downturn ended in June 2009, according to a panel of academic economists widely considered to the arbiter of the business cycle.

The economy has been growing since 2009, but more slowly and inconsistently than many Americans would like and many economists and policy makers had predicted. President Obama has made the economy’s condition his main focus this summer, promising new efforts to encourage economic growth, including a series of proposals on higher education that he is expected to announce Thursday. While taking credit for some improvement in the economy, he has acknowledged that many Americans have yet to see the benefits.

“We’ve got more work to do,” Mr. Obama said last month at Knox College in Galesburg, Ill. “Even though our businesses are creating new jobs and have broken record profits, nearly all the income gains of the past 10 years have continued to flow to the top 1 percent. The average C.E.O. has gotten a raise of nearly 40 percent since 2009. The average American earns less than he or she did in 1999.”

In the recession and its aftermath, many people went back to school, earning associate or bachelor’s degrees. Such credentials have helped, the new data shows, but they have been no guarantee against loss of income.

Households headed by people with only a high school diploma have seen their post-recession income decline by 9.3 percent, to $39,300 in June of this year, the report said. For households headed by people with an associate degree, median income declined by 8.6 percent in those four years, to $56,400. And among households headed by people with a bachelor’s degree or more, median income declined by 6.5 percent, to $84,700.

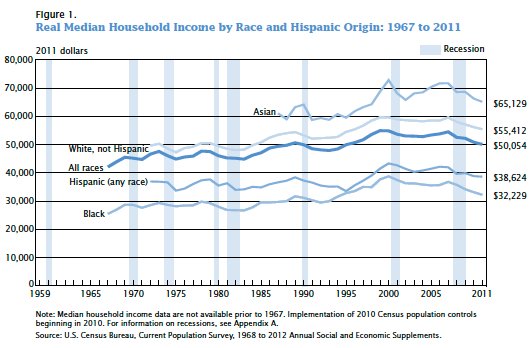
Since the end of the recession, the report said, income has declined by 3.6 percent for non-Hispanic white households, to $58,000, and by 4.5 percent for Hispanic households, to $41,000. Those changes were smaller than the 10.9 percent decline, to $33,500, for non-Hispanic black households, whose economic problems are likely to be a focus when Mr. Obama speaks next week on the 50th anniversary of the March on Washington.

Median income for households headed by people ages 65 to 74 increased by 5.1 percent, to $43,000, even though in many cases the head of the household was retired. By comparison, median income for households headed by people under age 25 fell 9.6 percent, to $31,300.

Median income declined by 4.5 percent for households headed by a person 25 to 34 years old, by 5.7 percent for those 35 to 44, by 2.5 percent for those 45 to 54, and by 7 percent for those 55 to 64. The report found no significant change for households headed by a person 75 or older.

Median income declined for households in three of four geographic regions, with the South showing the largest decline and the Midwest reporting no statistically significant change.

From June 2009 to June of this year, household income declined by 6.2 percent in the South, to $47,900; by 5.2 percent in the West, to $56,400; and by 3.9 percent in the Northeast, to $56,800.

By contrast, household income in the Midwest, $52,600, was not significantly different from what it was four years ago. Some parts of the Midwest have been helped by the natural-gas boom, while others have benefited from a modest manufacturing rebound in the last few years.

Article source: http://www.nytimes.com/2013/08/22/us/politics/us-median-income-rises-but-is-still-6-below-its-2007-peak.html?partner=rss&emc=rss

Economix Blog: Mixed-Race America

CATHERINE RAMPELL

CATHERINE RAMPELL

Dollars to doughnuts.

That map is from a new Census Bureau report about the population of mixed-race Americans, which grew 32 percent from 2000 to 2010. The population of single-race Americans, by contrast, grew 9.2 percent.

As a share of the total population, mixed-race Americans are still a tiny minority, just 2.9 percent, or about nine million people.

As you can see in the map, the states with the highest share of residents who report being of more than one race are Hawaii (23.6 percent), Alaska (7.3 percent), Oklahoma (5.9 percent) and California (4.9 percent).

Four distinct mixed-race combinations represented about 92 percent of all mixed-race people: people who reported being both white and black totaled 1.8 million; white and “some other race,” 1.7 million; white and Asian, 1.6 million; and white and American Indian and Alaska native, 1.4 million.

Article source: http://economix.blogs.nytimes.com/2012/09/27/mixed-race-america/?partner=rss&emc=rss

Economix Blog: Behind the Decline in Incomes

The Census Bureau just released its sweeping annual report on income, poverty and health insurance coverage.

As my colleague Sabrina Tavernise writes, median household income declined last year to $50,054, a level last seen in 1996 when adjusted for inflation. Here are a few quick graphical bullet points from other findings in the report:

1. Median incomes fell from 2010 to 2011 for all races, although the change was not statistically significant for Asians and Hispanics.


2. Inequality rose, and is at its highest level on record since 1967.

Source: Census Bureau

The Gini Index is a standard measure of inequality, in which higher values represent more unequal distributions of money income. The “equivalence-adjusted income estimate” (blue line above) takes into consideration the number of people living in each household, and how these people share resources and take advantage of economies of scale.

3. Men have gained more jobs in the recovery (dubbed the “he-covery”) but they also lost a lot more jobs in the recession (“man-cession”).

Source: Census Bureau

4. There’s more evidence that the work force is “hollowing out,” as there was significant job growth in the first, second and fifth income quintiles, but not in the third and fourth ones.

Source: Census Bureau

5. The share of people without health insurance fell. The biggest drop was among those 19 to 25 years old, who can now join their parents’ health insurance plans. (The number of insured children also showed a decline from 2010 to 2011, but it was not statistically significant.)

Source: Census Bureau

Article source: http://economix.blogs.nytimes.com/2012/09/12/behind-the-decline-in-incomes/?partner=rss&emc=rss

Economix Blog: Casey B. Mulligan: Changes in Inequality the 21st Century

DESCRIPTION

Casey B. Mulligan is an economics professor at the University of Chicago.

A couple of important measures of labor-market inequality have played out since 2008 much the way they did previously.

Today’s Economist

Perspectives from expert contributors.

One measure of changing inequality in the labor market, commonly used by economists, is the annualized 90-10 change: the annualized growth rate of wages at the 90th percentile of the distribution of wages for men working full time minus the growth rate of wages at the 10th percentile of the same distribution.

Because the 90th percentile wage is the wage below which 90 percent of working men earn, the annualized 90-10 change can be interpreted as the degree to which the wages of high-earning men grow more, or fall less, than the wages of low-earning men. The measure can in principle be negative, in which case the wages of less-skilled people would be partly catching up with the wages of skilled people.

I measured these changes using the Census Bureau’s Current Population Survey Merged Outgoing Rotation Group sample. (Analysis of wage patterns is often performed with the Census Bureau surveys, although most of them lack information on employee fringe benefits over and above wages and salaries.) The left part of the chart below shows the annualized 90-10 change over three time periods.

The first time period is 2000-8, the years of George W. Bush presidency, and the years before the 2009 depths of the “Great Recession.” Wages grew faster for high-skill people during these years: about 0.5 percentage points a year extra (roughly a cumulative four extra percentage points for the entire period).

Wages also grew faster for high-skill people between 2008 and 2010 (the last year for which I have data). The average growth differential between them and low-skill people was a whopping 2.6 percentage points a year.

One interpretation of these results is that the rewards for accumulating skill have been increasing over time, especially in the last two years. The more common and less euphemistic interpretation is that the rich have been getting richer, especially recently.

Perhaps the Great Recession of 2008-9 and slow recovery is to blame for all of this. For this reason, I looked separately at the recession period 2000-2. That recession (0.6 extra percentage points a year) looks a lot like the longer 2000-8 period (0.5 extra percentage points a year).

Another indicator of inequality is wage equality between the genders. The right part of chart shows changes in gender wage equality. The gender measures are positive if and when wages grow faster for women than for men and negative if and when male wages grow faster. The former is usually viewed as progress, because for centuries women have been earning less than men.

During the George W. Bush presidency (and a number of the presidencies before him), wages grew more for women than for men, about seven-tenths of one percentage a year more on an annual basis. During the first two years of the Obama presidency (or, if you want, during the Great Recession), the gender wage gap closed even more rapidly (1.3 percentage points a year), though less rapidly than it did in during the previous recession (1.6 percentage points a year).

President Obama is sometimes likened to Lyndon B. Johnson or Jimmy Carter, but theirs were not years when high-skill people were gaining ground at a faster pace than low-skill people and not years when women’s wages were catching up to men’s. When it comes to measures of labor-market inequality, the last few years so far look at lot like the years before 2008.

Perhaps that shows how Presidents Bush and Obama are not so different in their economic policies, or that presidents have little impact on important economic trends.

Article source: http://economix.blogs.nytimes.com/2012/09/12/changes-in-inequality-the-21st-century/?partner=rss&emc=rss

Economix Blog: The Poorest and Richest Counties

The county with the lowest poverty rate in America last year was Falls Church, Va. — actually an independent city — where about 3 percent of residents live in poverty, according to a new data release from the Census Bureau. The highest poverty rate was in Ziebach County, S.D., where about half of residents are below the poverty line.

Between 2007, the year the recession began, and 2010, the poverty rate rose by a statistically significant amount in nearly a quarter of counties (722 of 3,142) across the country.

Median incomes were, as you might expect, pretty closely related to poverty rates. The county with the highest median income in 2010 — $119,075 — was Loudoun County, Va., which is near Falls Church in the Washington suburbs. The lowest median income was in Buffalo County, S.D., just a hop, skip and jump away from Ziebach County. In Buffalo County, the median income was $20,577.

The interactive map above shows poverty rates for all adults, for children only and for school-age children (ages 5 to 17), as well as median incomes. You can click on the map and choose one of these options from the pull-down menu in the legend, and then mouse over any county to see how it fares.

Article source: http://feeds.nytimes.com/click.phdo?i=bd2c82ca8fe6ed4264892ab6594a8862

Economix Blog: Economic Insecurity

With the Census Bureau fine-tuning its definition of poverty, a group of “near poor” has emerged — those who are not officially poor but are perilously close to it.

Another way of putting that is to look at “economic security,” the amount of income necessary to cover basic expenses without relying on public subsidies.

A new report from Wider Opportunities for Women, a nonprofit group that previously produced an index of what it takes to do more than survive while working, shows that 45 percent of United States residents live without economic security. That means they are not earning enough income to cover basic expenses, plan for important life events like college or save for emergencies like unexpected health bills.

“What does it take for households in this country to get by and be able to plan for their own futures based on the work that they do?” said Donna Addkison, president and chief executive of Wider Opportunities for Women. “We’re really looking at not just the lowest of the lowest income households but that slice of households that live somewhere above the poverty line but are constantly in danger of being thrown into financial catastrophe, and that’s a much larger slice of the American public than we are currently talking about.”

Although the study uses median incomes on a national basis, Wider Opportunities and its research partners are working on tables that define what economic security would mean on a state-by-state basis. Obviously, the income needed to cover basic expenses would be higher in New York City than in Omaha.

The report showed that 55 percent of children live in households where families do not earn enough to achieve economic security. Even among those households with two full-time workers, 22 percent of those families with children earn less than is necessary to guarantee economic security.

The most vulnerable households are those led by single mothers, as well as African-American and Hispanic households. Only 18 percent of households headed by single mothers are living with economic security, while two-thirds of Hispanic households and 62 percent of African-American households are not earning enough to cover basic needs and saving requirements.

Part of the problem, Ms. Addkison said, is that so many jobs pay low wages. According to the report, less than 13 percent of the jobs that the Labor Department projects will be created by 2018 will pay wages that will be sufficient to allow families to keep their heads above water.

“We have a construct in this country that if you work full time and keep your nose clean and live by the rules, you will get that full-time job that allows you to take care of your family,” Ms. Addkison said. “And what we’re finding is that workers who are working full time or the equivalent are still struggling.”

Article source: http://feeds.nytimes.com/click.phdo?i=15f337806dda2a3ec79d9b6ef9d53bcb

Families Feel Sharp Edge of State Budget Cuts

Some states, including Florida and Missouri, have decided to shrink the duration of state unemployment benefits paid to laid-off workers, while others, including Arizona and California, are creating new restrictions on cash aid for low-income residents.

Here in Michigan, more than 11,000 families received letters last week notifying them that in October they will lose the cash assistance they have been provided for years. Next year, people who lose their jobs here will receive fewer weeks of state unemployment benefits, and those making little enough to qualify for the state’s earned income tax credit will see a far smaller benefit from it.

Some political leaders see these sorts of cuts as unfortunate necessities to help bridge their state’s financial gaps. Others see them as overdue limits on out-of-control government handouts — some lawmakers here fumed, for example, that 30,000 college students, newly dropped from the state’s food stamp rolls, should never have been allowed to collect such benefits in the first place.

Whatever the motive, such policy changes come as the downturn has left a growing number of low-income families in worse financial trouble.

The percentage of children living in poverty rose during the last decade, particularly once the recession hit and unemployment soared.

By 2009, about 2.4 million more children’s families lived below the poverty line than in 2000, an increase of 18 percent, according to a recent analysis of Census Bureau data by the Annie E. Casey Foundation, a child advocacy group. In states like this, where Republicans took control of the capital this year, the new cuts have helped resolve Michigan’s expected budget gap, once estimated at $1.4 billion.

“Michigan can no longer afford to provide lifetime assistance,” said Sheryl Thompson, an official with the state Department of Human Services, which reported that of those being dropped from the state’s cash-assistance rolls, some 1,200 families had been receiving payments for 10 years, more than 700 others for a dozen years, and an additional 400 families had been getting payments for 14 years.

The pattern of new cuts around the nation leads some advocates to fear that the number of low-income families will only grow in the next few years if programs they can lean on shrink or vanish.

“We’re O.K. unless something — anything at all — goes wrong,” said Rachel Haifley, who lives here in Lansing and said she works part-time making a little less than $9 an hour and receives child support for her two young sons, 1 and 3.

Ms. Haifley said she has become an expert at seeking out giveaways, thrift shops and bargains — for clothes, portable cribs, toys for the boys. “All I want is for them to feel like everyone else,” she said. “I don’t want them to grow up and ask me why they’re poor.”

In Dearborn Heights, Celia Kane-Fecay, another mother of two, said she has given up on the job hunt for now and returned to college — with help from $597 a month in cash assistance, Medicaid and any other aid she can track down with what she has come to describe unhappily as her daily list of begging phone calls. “You don’t ever want to be here,” she said.

Signs of new poverty are already evident. A project by the Annie E. Casey Foundation Kids Count Data Book found that by 2010, nearly 11 percent of the nation’s children, or 7.8 million children, had at least one parent who was unemployed, when only about half as many were in such circumstances in 2007. And since four years ago, the study found, at least 5.3 million children have been affected by home foreclosures.

Meanwhile, around the nation, lawmakers have weighed new limits to tax credits for low-income people; in Michigan, a proposal to throw out the earned income tax credit entirely was dropped, but lawmakers shrank the benefit — to an average of $138 a year for a Michigan family, advocates say, from $432 last year.

Six states have approved reductions in the length of state unemployment benefits. The notion appalls people like Jeananne Bishop, who has been desperately searching for a job since July 2010 and found herself washing her hair with laundry detergent at one point because she could not afford shampoo.

Ms. Bishop said her continuing benefits — now part of a federally financed extension — are the only thing keeping her afloat. Michigan’s shortened unemployment benefit limits will apply starting next year, but Ms. Bishop, 56, of Benton Harbor, seemed skeptical that much will have changed in the job market for them, cautioning, “No one calls back.”

Article source: http://feeds.nytimes.com/click.phdo?i=4f72116b160621e53c3b82eb4b083ae3

Sales of New Homes Fell Again in July

Sales of new homes reached an annual rate of 298,000 in July, down from a rate in June that was revised to 300,000 from 312,000, the Census Bureau report said. The July figures fell short of analysts’ expectations for a rate of 310,000.

The median sales price of a new home was $222,000 in July, also down from the previous month. The stock of new homes for sale at the end of July was 165,000, the lowest this year, and would last slightly more than six months at the current sales rate.

For months, most indicators of the housing market have suggested bleak conditions. The number of permits issued to builders of single-family houses has also declined.

Patrick Newport, United States economist for IHS Global Insight, said that his company had forecast that sales of new homes would fall to a record low this year, 319,000, compared with 321,000 in 2010.

“It has gotten worse for builders,” Mr. Newport said. “They are stuck in a market where they cannot sell new homes.”

In addition, demand for new homes is stagnant despite record low mortgage interest rates, and competition from foreclosures continues to cloud the sector, said Joshua Shapiro, chief United States economist at MFR Inc.

“This suggests that prices will continue to edge lower at the bottom end of the market even as demand for these homes picks up a bit,” Mr. Shapiro said.

The sales rate in July came close to the record low of 281,000 in February, and the level of inventories in recent months this year has been the lowest recorded since December 1967, he wrote in a research note.

“We are just bouncing along the bottom,” Mr. Shapiro said in a telephone interview. “There is no indication out there that anything is improving. It is bouncing along at historic lows at this point.”

Economists said it would take a turnaround in the American job market to return some vitality to the housing sector.

“We need job growth but in conjunction with that, housing prices have got to stop dropping,” Mr. Newport said.

Still, one analyst said that the market was showing the potential to recover in the years ahead despite weakness in the monthly data. The analyst, Russell Price, a senior economist with Ameriprise Financial, noted that median and average prices were higher in July compared with a year ago.

“Generally we are forming a base in the housing sector this year,” he said. “On aggregate, I think that conditions are solidifying at historically low levels. We are unlikely to go any further down.”

Mr. Price said, “As the economy does recover, and you get less competition from foreclosure sales, the market is poised for a relatively solid rebound in the years ahead.”

Article source: http://feeds.nytimes.com/click.phdo?i=357456e0ad4498ef9f6eb968ed46fdb8

Recession Study Finds Hispanics Hit the Hardest

The study, which used data collected by the Census Bureau, found that the median wealth of Hispanic households fell by 66 percent from 2005 to 2009. By contrast, the median wealth of whites fell by just 16 percent over the same period. African Americans saw their wealth drop by 53 percent. Asians also saw a big decline, with household wealth dropping 54 percent.

The declines have led to the largest wealth disparities in the 25 years that the bureau has been collecting the data, according to the report.

Median wealth of whites is now 20 times that of black households and 18 times that of Hispanic households, double the already marked disparities that had prevailed in the decades before the recent recession, the study found.

“It’s a very stark reminder of the high share of minorities who live at the economic margins of this country,” said Paul Taylor, executive vice president of the Pew Research Center and an author of the report. “These data really show their economic vulnerability.”

Household wealth, also referred to in the report as net worth, is made up of assets, like a house, a car, savings and stocks, minus debts, like mortgages, car loans and credit cards. It is tracked by the Census Bureau in the Survey of Income and Program Participation, a broad sampling of household wealth by race and ethnicity.

Nearly two-thirds of Hispanics’ median net worth in 2005 came from home equity, according to the report, and when the housing market collapsed, so did their wealth. Median home equity for Hispanics fell by 51 percent in the period of the survey. The drop was compounded by the fact that Hispanics tended to live in the places that were hit hardest in the recession, like Florida and California, the report said.

Armando Moya, a Mexican immigrant from Woodbridge, outside Washington, experienced these swings of fortune first-hand. For a few happy years, he believed he had avoided his father’s fate of scraping by. He bought a house with a backyard and opened a taco restaurant with his brothers. His bank account was growing, and he took his family on vacations several times a year.

Mr. Moya lives in Prince William County, where the Hispanic population more than tripled from 2000 to 2010, according to the Migration Policy Institute, with many newcomers working in construction trades that were flourishing in the rapidly growing suburbs of Washington.

To capitalize on the influx, Mr. Moya, who is now 38 and had been working in restaurants since he came to the United States in the early 1990s, decided to start his own, and together with his brother opened Ricos Tacos Moya in 2005.

In the same year, he bought a house valued at $350,000. His monthly payments were more than $2,300, and with hungry workers filling his restaurant, he managed.

But when the collapse of the housing market swept like a wave through this Northern Virginia county, taking his house, and his bank account, and many of his customers along with it, he lost his middle-class lifestyle.

“Everything was going down,” he said.

Now he is back where he started, living with his family in a rented apartment, and working seven days a week in the taco restaurant. His house sold for $135,000 to a couple from Morocco, he said.

“My money changed,” he said. “I lost my house.”

The share of Americans with no wealth at all rose sharply during the recession. A third of Hispanics had zero or negative net worth in 2009, up from 23 percent in 2005. For blacks, the portion rose to 35 percent from 29 percent, and for whites, it rose to 15 percent from 11 percent.

About a quarter of all black and Hispanic households owned nothing but a car in 2009. Just 6 percent of whites and 8 percent of Asians were in that situation.

Whites were less affected by the crisis, largely because their wealth flowed from assets other than housing, like stocks. A third of whites owned stocks and mutual funds in 2005, compared with 8 percent of Hispanics and 9 percent of blacks.

The median value of stocks and mutual funds owned by whites dropped by 9 percent from 2005 to 2009. In comparison, the median value of holdings for those blacks who held stocks dropped by 71 percent, most likely because they had to sell when prices were low, Mr. Taylor said.

The median wealth of Hispanic and black households is at its lowest point since 1984, when the Census Bureau first conducted the study, the report said.

Mr. Moya counts himself lucky to still have his restaurant. He has to work weekends at a nightclub in Washington to keep up with his rent. His life is increasingly resembling his father’s — subsisting, without saving — but he has pinned his hopes for a better life on his sons, and he has discarded the idea of returning to Mexico.

“I want my house back,” he said. “I’m working for my house right now.”

Article source: http://feeds.nytimes.com/click.phdo?i=4440d0f2650c9f73dfc5c4d3aa9b39a6