
CATHERINE RAMPELL
Dollars to doughnuts.
Of all American states, New York again has the most unequal income distribution, according to a new report from the Census Bureau. Wyoming has the most equitably distributed income.
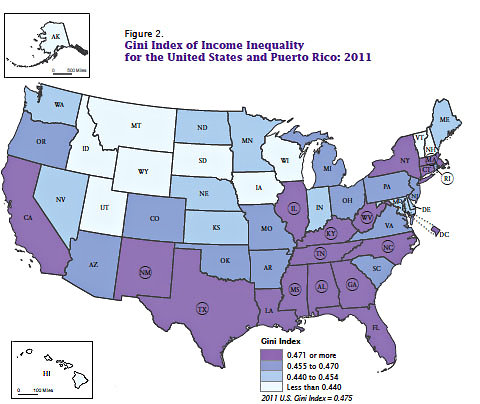 Source: U.S. Census Bureau, 2011 American Community Survey. A state abbreviation surrounded by a circle denotes the value for the state is not statistically different from the overall country’s Gini index.
Income inequality is measured by the Gini index, which runs from zero to one. A zero represents a society where income is distributed exactly proportionally among every household. A one indicates maximum inequality, where one household has all the income and all the others have none.
The Gini index value for the United States in 2011 was 0.475, higher than it was in 2010 at 0.469. The index rose in 20 states last year (including New York); there was no statistically significant change in the rest of the states and the District of Columbia (which, at 0.534, has a higher index value than any state).
The Gini index value for New York State was 0.503, which means the state’s household incomes are about as equally distributed as those in Costa Rica, at least according to the most recent international data available.
The report also looked at median household incomes across the states, which showed great inequality among states as well as within them. The median household income ranged from a low of $36,919 in Mississippi to a high of $70,004 in Maryland.
As previously reported, the national median income fell from 2010 to 2011. There was only one state in which it rose a statistically significant amount, after adjusting for inflation: Vermont, where the median household income was $52,776 in 2011 after having been $50,707 in 2010.
Article source: http://economix.blogs.nytimes.com/2012/09/20/new-york-state-leads-in-income-inequality/?partner=rss&emc=rss
