
Casey B. Mulligan is an economics professor at the University of Chicago.
A couple of important measures of labor-market inequality have played out since 2008 much the way they did previously.
Today’s Economist
Perspectives from expert contributors.
One measure of changing inequality in the labor market, commonly used by economists, is the annualized 90-10 change: the annualized growth rate of wages at the 90th percentile of the distribution of wages for men working full time minus the growth rate of wages at the 10th percentile of the same distribution.
Because the 90th percentile wage is the wage below which 90 percent of working men earn, the annualized 90-10 change can be interpreted as the degree to which the wages of high-earning men grow more, or fall less, than the wages of low-earning men. The measure can in principle be negative, in which case the wages of less-skilled people would be partly catching up with the wages of skilled people.
I measured these changes using the Census Bureau’s Current Population Survey Merged Outgoing Rotation Group sample. (Analysis of wage patterns is often performed with the Census Bureau surveys, although most of them lack information on employee fringe benefits over and above wages and salaries.) The left part of the chart below shows the annualized 90-10 change over three time periods.
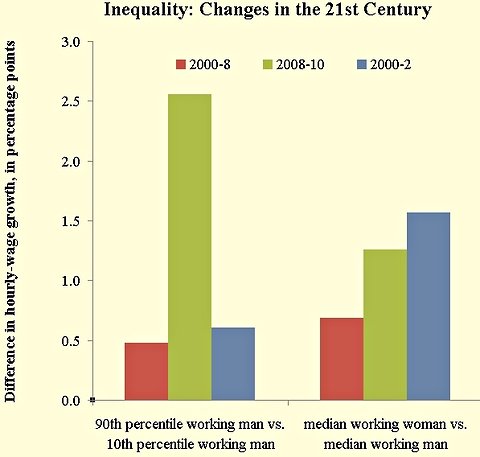
The first time period is 2000-8, the years of George W. Bush presidency, and the years before the 2009 depths of the “Great Recession.” Wages grew faster for high-skill people during these years: about 0.5 percentage points a year extra (roughly a cumulative four extra percentage points for the entire period).
Wages also grew faster for high-skill people between 2008 and 2010 (the last year for which I have data). The average growth differential between them and low-skill people was a whopping 2.6 percentage points a year.
One interpretation of these results is that the rewards for accumulating skill have been increasing over time, especially in the last two years. The more common and less euphemistic interpretation is that the rich have been getting richer, especially recently.
Perhaps the Great Recession of 2008-9 and slow recovery is to blame for all of this. For this reason, I looked separately at the recession period 2000-2. That recession (0.6 extra percentage points a year) looks a lot like the longer 2000-8 period (0.5 extra percentage points a year).
Another indicator of inequality is wage equality between the genders. The right part of chart shows changes in gender wage equality. The gender measures are positive if and when wages grow faster for women than for men and negative if and when male wages grow faster. The former is usually viewed as progress, because for centuries women have been earning less than men.
During the George W. Bush presidency (and a number of the presidencies before him), wages grew more for women than for men, about seven-tenths of one percentage a year more on an annual basis. During the first two years of the Obama presidency (or, if you want, during the Great Recession), the gender wage gap closed even more rapidly (1.3 percentage points a year), though less rapidly than it did in during the previous recession (1.6 percentage points a year).
President Obama is sometimes likened to Lyndon B. Johnson or Jimmy Carter, but theirs were not years when high-skill people were gaining ground at a faster pace than low-skill people and not years when women’s wages were catching up to men’s. When it comes to measures of labor-market inequality, the last few years so far look at lot like the years before 2008.
Perhaps that shows how Presidents Bush and Obama are not so different in their economic policies, or that presidents have little impact on important economic trends.
Article source: http://economix.blogs.nytimes.com/2012/09/12/changes-in-inequality-the-21st-century/?partner=rss&emc=rss