The Census Bureau just released its sweeping annual report on income, poverty and health insurance coverage.
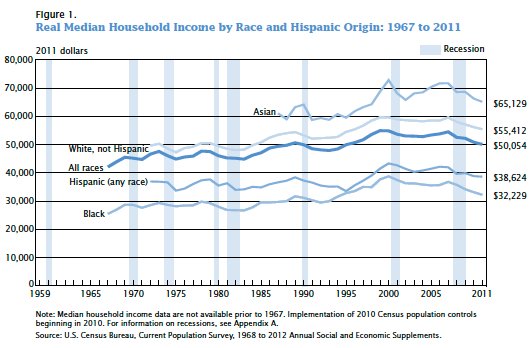
As my colleague Sabrina Tavernise writes, median household income declined last year to $50,054, a level last seen in 1996 when adjusted for inflation. Here are a few quick graphical bullet points from other findings in the report:
1. Median incomes fell from 2010 to 2011 for all races, although the change was not statistically significant for Asians and Hispanics.
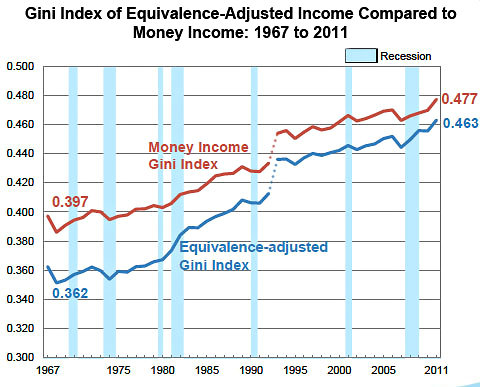
2. Inequality rose, and is at its highest level on record since 1967.
 Source: Census Bureau
The Gini Index is a standard measure of inequality, in which higher values represent more unequal distributions of money income. The “equivalence-adjusted income estimate” (blue line above) takes into consideration the number of people living in each household, and how these people share resources and take advantage of economies of scale.
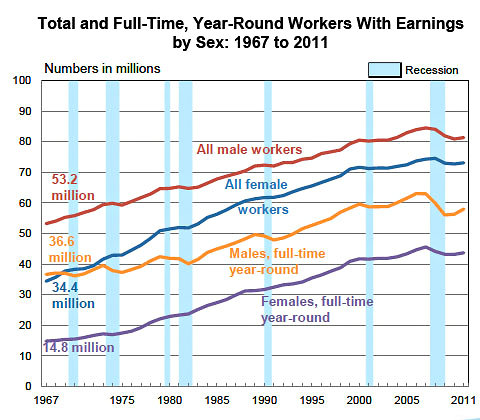
3. Men have gained more jobs in the recovery (dubbed the “he-covery”) but they also lost a lot more jobs in the recession (“man-cession”).
 Source: Census Bureau
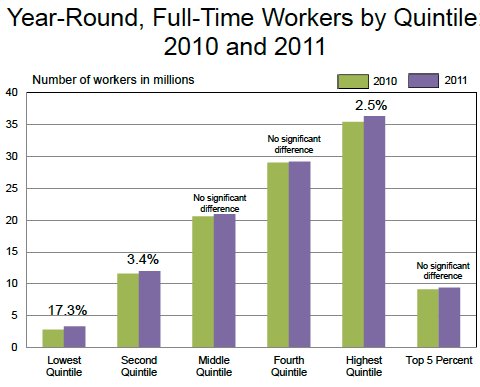
4. There’s more evidence that the work force is “hollowing out,” as there was significant job growth in the first, second and fifth income quintiles, but not in the third and fourth ones.
 Source: Census Bureau
5. The share of people without health insurance fell. The biggest drop was among those 19 to 25 years old, who can now join their parents’ health insurance plans. (The number of insured children also showed a decline from 2010 to 2011, but it was not statistically significant.)
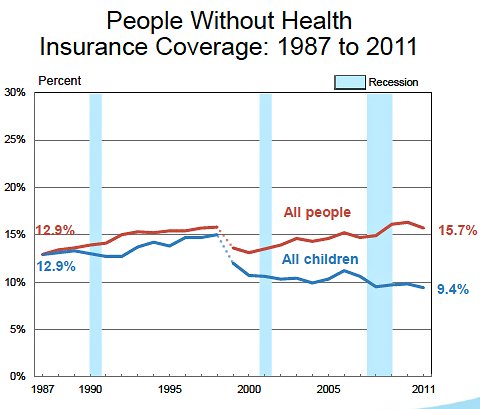 Source: Census Bureau
Article source: http://economix.blogs.nytimes.com/2012/09/12/behind-the-decline-in-incomes/?partner=rss&emc=rss
Speak Your Mind
You must be logged in to post a comment.