May 8, 2024

Off the Charts: Gender Gaps Appear in Employment Recovery

The Bureau of Labor Statistics reported last week that women held 54,623,000 private sector jobs in June, an increase of 116,000 from the previous month and 63,000 more than they held in December 2007, when the previous high was set. The gap between records — 65 months — was the longest such period since the government began keeping track of the gender of job holders in 1964.

Men have been gaining jobs as well, but the 59,428,000 jobs they now hold is 1.8 million jobs below the previous high, reached in June 2007.

The relatively better performance of women does not appear to be the result of employer preference for female employees. In fact, the opposite may be true. In most industries, women’s share of the labor force is down from what it was when the recession began. But some professions with a predominantly female work force have done better than the economy as a whole.

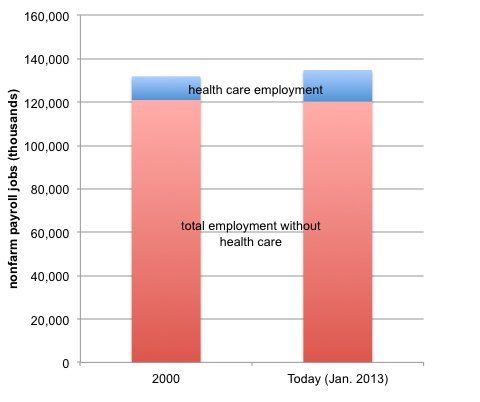
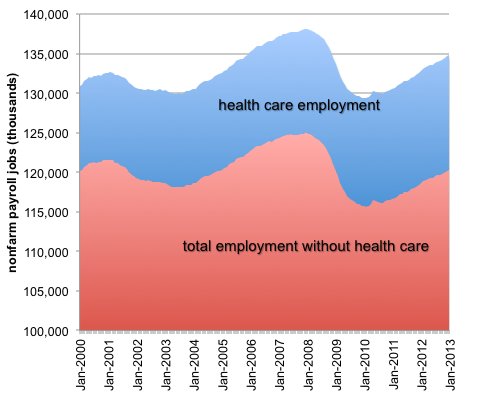
The best example of that is health care, where about 80 percent of the jobs are held by women. Employment in that industry continued to rise throughout the downturn.

The latest figures indicate that the number of men with jobs in the field is up 15.8 percent since January 2008, when overall employment peaked just as the Great Recession began, while female employment has risen by just 9.8 percent. But given the preponderance of women in health care jobs — about four out of every five workers in the field are women — those numbers translate into new jobs for more than twice as many women as men.

The charts accompanying this article compare job growth or shrinkage since January 2008. Women hold 0.1 percent more private sector jobs now than they did then, but male employment is still 2.8 percent below its level then.

The number of government jobs has been steadily shrinking, even as the economy recovers, and both male and female public sector employment is 2.4 percent below the levels of early 2008. There was a brief recovery in government employment in 2010 as temporary workers were hired to help conduct the census, but the underlying trend was negative.

The figures come from the government’s monthly survey of employers, which asks not only how many employees a company has but also how many of them are women. The figures are subject to revision, and there is no assurance that the slim female gain shown in the latest report will stand once the figures become final. For some industries, the figures are released with a month’s delay, and the charts for those industries reflect May employment levels.

In industries as disparate as manufacturing, information services and financial services, women and men lost jobs at about the same rate in the first year or two after the economy began to decline. But as the industries stabilized or began to recover, men were far more likely than women to find jobs. Since June 2009, significant numbers of jobs in all three industries have gone to men, while the ranks of women among jobholders continued to shrink in two of the fields, manufacturing and information services, and stabilize in the third, financial services.

In the category that includes restaurants and bars — in which women hold a small majority of the jobs — men and women lost jobs at roughly the same rate until the end of 2009. But since then, as employment increased, men have been more likely to find positions. For the entire period, male employment in such establishments is up more than 8 percent, while female employment has risen nearly 5 percent.

In the early months of the downturn, women came tantalizingly close to realizing a new milestone. In October 2009, women held 49.99 percent of all jobs, with private and public sectors combined. The difference in job totals was only 24,000 — 64,819,000 for men and 64,795,000 for women. But since then, as employment has risen, the female share has dipped to 49.37 percent, and men now have 1.7 million more jobs than women.

Floyd Norris comments on finance and the economy at nytimes.com/economix.

Article source: http://www.nytimes.com/2013/07/13/business/economy/gender-gaps-appear-in-employment-recovery.html?partner=rss&emc=rss

Economix: The Old vs. the Young

The Great Recession has been a disaster for the employment prospects of the young. Almost one in four teenagers looking for a job still can’t find one.

Americans 16 to 24 years old suffered the sharpest drop in employment between 2008 and 2010, and jobs for young workers have barely ticked up since then.

Source: Bureau of Labor Statistics, via Haver Analytics

Today, only 45 percent of young Americans in that age group have a job, almost 6 percentage points less than when the recession started in December 2007.

Source: Bureau of Labor Statistics, via Haver Analytics

The story is quite different at the other end of the life cycle. Eighteen percent of Americans of retirement age hold a job, some 2 percentage points more than when the recession started. The employment rate of these elderly workers is at its highest since May 1965 — before the enactment of Medicare. They are filling the largest share of jobs since 1956.

Source: Bureau of Labor Statistics, via Haver Analytics

So what’s going on? Older Americans may have a more pressing need for a job. The homes of many are probably still underwater. Though the stock market has recovered the ground lost during the downturn, interest rates remain near all-time lows — crimping the elderly’s income from savings.

And we should expect the employment rate of the elderly to continue rising. The structure of Social Security benefits is one of the most important determinants of employment among the elderly. And Social Security is getting stingier over time.

The age of full retirement rose by two months for many workers entering retirement at the beginning of the recession. It has remained constant since then, but is expected to start rising again for workers born in 1955 and after, who will reach full retirement age in a few years.

Over the long term, this might be a good thing for the economy, raising the nation’s sustainable growth rate — the growth manageable without inflation — above the 2.25 percent forecast by the Congressional Budget Office. But in the next few years, young workers would probably prefer older workers to retire.

Article source: http://economix.blogs.nytimes.com/2013/05/03/the-old-vs-the-young/?partner=rss&emc=rss

Economix Blog: Health Care Aside, Fewer Jobs Than in 2000

CATHERINE RAMPELL

CATHERINE RAMPELL

Dollars to doughnuts.

Uwe Reinhardt had a fascinating post Friday about the buffer that health care spending has provided in the last few years. Health care has provided a steady contribution to gross domestic product even as other sectors cut back dramatically. He also notes that in the last two decades, it has created more jobs on a net basis than any other sector.

I’d like to point out one other important accomplishment of the much-maligned health care industry. Not only has it added more jobs than any other sector, but without it, there would actually be slightly fewer jobs in the United States today than in 2000.

In 2000, the economy had about 121 million non-health-care payroll jobs. Today, on a seasonally adjusted basis, there are 120 million non-health-care jobs. Meanwhile, the health care industry has added about 3.6 million jobs in that time frame, growing about 33 percent (14.5 million health care jobs today versus 10.9 million in 2000).

Source: Bureau of Labor Statistics, via Haver Analytics. January 2013 figures are seasonally adjusted; 2000 figures are annual numbers. Source: Bureau of Labor Statistics, via Haver Analytics. January 2013 figures are seasonally adjusted; 2000 figures are annual numbers.


There have been times since 2000 that the country has had more non-health-care jobs on net than it had at the turn of the millennium, but that has not been true since late 2008. Here’s a look at the longer-term monthly numbers. Note that the vertical axis does not go down to zero to better show the change:

Source: Bureau of Labor Statistics, via Haver Analytics. Note that the vertical axis does not start at zero, better showing the change over time. Source: Bureau of Labor Statistics, via Haver Analytics. Note that the vertical axis does not start at zero, better showing the change over time.

Is it a good thing that the health care industry has been basically keeping the job market afloat? That depends on your perspective.

Health care is a notoriously inefficient industry — in 2008, there were five people performing administrative support for every one doctor — and a lot of the jobs that have been created in recent years probably involve feeding that inefficiency.

Market pressures don’t force streamlining in health care the way they do in other industries. That’s partly because of the way Americans pay for health care and the way the government subsidizes health care consumption. It’s also partly because health care is relatively shielded from international competition, since many medical services are difficult to offshore. It’s hard to have someone draw your blood from India, for example.

In any case, given how weak the economy is right now, it seems unlikely that the health care industry is snatching many workers away from other industries where their skills would be put to more productive use.

Article source: http://economix.blogs.nytimes.com/2013/02/20/health-care-aside-fewer-jobs-than-in-2000/?partner=rss&emc=rss

Economix Blog: The Slide in Wages

CATHERINE RAMPELL

CATHERINE RAMPELL

Dollars to doughnuts.

Job growth has been modest but steady in the last few months. Wages, on the other hand, have been falling since August, after adjusting for both seasonality and price increases.

Source: Bureau of Labor Statistics, via Haver Analytics. Hourly earnings are shown in September 2012 dollars, inflation-adjusted using the Consumer Price Index. Source: Bureau of Labor Statistics, via Haver Analytics. Hourly earnings are shown in September 2012 dollars, inflation-adjusted using the Consumer Price Index.

Assuming this is not just statistical noise, it’s possible that lower wages are enabling or encouraging employers to hire more workers, said John Ryding, the chief economist at RDQ Economics. When the price of something falls, buyers can afford more of it.

Another possible explanation relates to the types of jobs being created. If a sizable share of the jobs being created were low-wage jobs — which was the case from the first quarter of 2010 through the first quarter of 2012, anyway — the average wage could get dragged down.

For broader context on income stagnation over the last decade and its potential causes, check out this recent article by my colleague David Leonhardt.

Article source: http://economix.blogs.nytimes.com/2012/11/02/the-slide-in-wages/?partner=rss&emc=rss

Economix: How Bureau of Labor Statistics Tames Volatile Raw Data for Jobs Reports

7:32 p.m. | Updated

CATHERINE RAMPELL

CATHERINE RAMPELL

Dollars to doughnuts.

The unemployment rate fell to 7.8 percent in September, its lowest level since President Obama took office. With just a month to go before the election, the news seemed too good to be true, at least for some Mitt Romney supporters.

Almost immediately some conservative pundits began accusing the Labor Department, which released the jobs numbers on Friday, of cooking the books. After all, the household survey — the survey that the unemployment rate comes from — showed that the number of people with jobs rose 873,000 in September, though the gain had averaged 164,000 each month earlier this year.

These numbers are always tremendously volatile, but the reasons are statistical, not political. The numbers come from a tiny survey with a margin of error of 400,000. Every month there are wild swings, and no one takes them at face value. The swings usually attract less attention, though, because the political stakes are usually lower.

Look how noisy these numbers are, and always have been! Look how noisy these numbers are, and always have been!

The numbers, by the way, are especially imprecise (and prone to revision) when the economy is making a turn, or when regular seasonal patterns start to change. And there is reason to believe that one particular seasonal pattern — the start of the college school year — may be partly responsible for the big swing in September.

One of the biggest sources of volatility in the last couple of months (and one of the major contributors to the big bump in job-getters in September) was the group of workers between 20 and 24 years old.

Historically, the employment levels for that group have dropped sharply in September, probably because many people in their early 20s are leaving summer jobs and going back to school.

For each year since 1948, the average level of employment for this group has fallen by 398,000 from August to September. In fact, before this year, employment for this age group had risen just two times in that period: 1954 (a gain of 5,000), and 1961 (a gain of 22,000).

This year was the third time on record that the number of people in this age group gained jobs in September, and the gain was big: 101,000.

Source: Bureau of Labor Statistics. Numbers are not adjusted for seasonality. Source: Bureau of Labor Statistics. Numbers are not adjusted for seasonality.

How to explain this major deviation from the historical trend, other than conspiracy theories?

If you look back at August, an unusually high share of this age group stopped working, compared with past employment patterns in August. From 1948 to 2011, the number of those 20 to 24 who had jobs fell by an average of 98,000 from July to August. This past August, it fell by 530,000, the biggest loss on record.

Over the last couple of decades, in fact, the job losses for this age group have been growing each August, suggesting that over time young people have been leaving their summer jobs earlier and earlier.

Source: Bureau of Labor Statistics. Numbers are not adjusted for seasonality. Source: Bureau of Labor Statistics. Numbers are not adjusted for seasonality.

In other words, seasonal patterns might be evolving — people starting school and leaving their summer jobs earlier in the summer — which has big implications for how the Labor Department digests and reports the monthly employment data.

The Bureau of Labor Statistics adjusts its raw survey data to correct for seasonal patterns, and since a decline in employment is expected for those 20 to 24, the economists at the bureau increased the level of employment for this group in the seasonally adjusted numbers.

Changes in seasonal patterns like this one can introduce more error into the headline numbers, and can at least partly explain why the overall change in household employment looked so much bigger in September than seems plausible. After seasonal adjustment, the increase in employment among those 20 to 24 was given as 368,000. That’s about 42 percent of the overall increase in employment growth for people of all ages. (After making seasonal adjustments on the August figures, the employment level for 20- to 24-year-olds was reported as declining by 250,000.)

All of which is to say the bureau aims to release the most informative numbers it can. But it is seeking to measure the state of the American job market quickly, based on surveys that are inherently incomplete — and the adjustments that are meant to fill in the gaps have their own shortcomings, particularly when seasonal trends change.

In case you still believe that the models the bureau uses are being manipulated to put President Obama in a better light, note that there are no political appointees currently serving in the Bureau of Labor Statistics. The employees are all career civil servants who have worked under both Republican and Democratic administrations. (The commissioner of the bureau is supposed to be a political appointee, but that position is vacant. The acting commissioner, John M. Galvin, has held the position since January, and he is a career civil servant.)

Economists at the Bureau of Labor Statistics regularly adjust the models they use to account for factors like seasonality and the number of new companies entering the economy, and the revisions are often very large.

Economists outside the bureau have been weighing in, too, both on how the latest numbers should be adjusted and what the next few months of jobs reports should look like. A paper presented last month as part of the Brookings Papers on Economic Activity series, for example, incorporated data on people flowing into and out of unemployment to forecast that the unemployment rate would most likely stagnate for a few months to come.

Article source: http://economix.blogs.nytimes.com/2012/10/05/explaining-the-big-gain-in-job-getters/?partner=rss&emc=rss

Economix Blog: Share of Men in Labor Force at All-Time Low

CATHERINE RAMPELL

CATHERINE RAMPELL

Dollars to doughnuts.

Friday’s jobs report for August was chock full of all sorts of bad news. Among the most distressing: The share of men actively participating in the labor force — that is, working or looking for work — was at an all-time low.

Source: Bureau of Labor StatisticsSource: Bureau of Labor Statistics

Just 69.8 percent of all men over age 16 were in the labor force in August, compared to a long-term average of 78.3 percent since the Labor Department began tracking these data in 1948. The share has been falling pretty steadily over the last six decades but has declined sharply in the last few years.

Some of this could be attributed to the fact that the country has been aging, so more people are of retirement age. But the participation rate has also fallen dramatically for men of prime working age, 25-54:

Source: Bureau of Labor StatisticsSource: Bureau of Labor Statistics

There are many competing (or in some cases complementary) arguments for why the share of men in the labor force has been declining.

For example, a lot of traditionally male jobs, in industries like manufacturing and construction, have disappeared, and many of the men who were displaced gave up looking for work when they couldn’t find similar jobs.

The federal disability rolls have also skyrocketed, and when people go on disability, they rarely return to the labor force:

Additionally, the share of women in the labor force rose steadily from the 1940s to the late 1990s. There is some debate about what effect this had on men’s employment. Most economists I’ve spoken with have argued that women were not “taking” men’s jobs, especially since for a long time “women’s work” was distinctly different from “men’s work” and the total employment pie was growing. At the very least, though, the entrance of more women into the job market theoretically made it less essential for married men to work, even if women tend to be in much lower-paying jobs.

What say you, readers? Why do you think the share of men working has fallen so dramatically?

Article source: http://economix.blogs.nytimes.com/2012/09/07/share-of-men-in-labor-force-at-all-time-low/?partner=rss&emc=rss

Economix Blog: Casey B. Mulligan: Hiring, ‘Quits’ and Layoffs

DESCRIPTION

Casey B. Mulligan is an economics professor at the University of Chicago.

The recession and lack of recovery have often been characterized as a lack of hiring, rather than an extraordinary number of employer-employee “separations” (a separation is a layoff or what the Bureau of Labor Statistics calls a “quit”). But the aggregate data on hiring, quits and layoffs can be misleading.

Today’s Economist

Perspectives from expert contributors.

The chart below from the Bureau of Labor Statistics shows total hires, separations and total employment from December 2000 to December 2009. The shaded area to the right indicates the start of the most recent recession. Both separations and hires fell about 20 percent (the hires dropped sooner).

Bureau of Labor Statistics

However, this characterization is quite different for young people than for the rest of the work force. Even during business cycle expansions, young people have high rates of job turnover. The number of young people hired during a typical month is disproportionately high, as is the number of young people quitting or getting laid off (I use the term “layoff” to refer to both layoffs and discharges).

For this reason, young people could dominate the job turnover statistics, even while they do not dominate the employment statistics.

A paper by Michael Elsby, Bart Hobijn and Aysegul Sahin, using a method developed by my University of Chicago colleague Robert Shimer, estimated job separations for different age groups according to the number of people flowing into unemployment. They found a very different pattern for people 16-24 than they did for people 25-54.

Estimated job separations among employees ages 25-54 were 33 percent greater in 2009 than they were in 2007. I tried to update their estimates through 2010 and found that job separations still remained greater than they were in 2007.

In contrast, the low employment rates for young people since 2007 are almost entirely explained by low hiring rates.

The Bureau of Labor Statistics also reports that the composition of job separations has changed a lot since 2007. Before the recession began, quits were by far the most common type of separation; now the number of quits about equals the number of layoffs.

Perhaps the decline in quits is a signal of what’s ailing the economy, although I view it largely as a consequence of the unemployment insurance system. A person who quits his or her job is not eligible for unemployment insurance. As a result, calling a job separation a “quit” rather than a “layoff” results in the loss of unemployment benefits.

I estimate that, before the recession began, a person beginning unemployment would receive about 12 weeks of unemployment benefits, on average, if he or she were eligible for benefits. By 2010, that average was up to about 34 weeks. At $300 a week, that means that the government subsidy for calling a separation a “layoff” rather than a resignation was up to about $10,000 from $3,600.

There is also the employer payroll tax consequence of layoffs to consider, but overall employers and employees now often have a lot to gain by calling their separation a layoff rather than a quit.

These are a couple of reasons the aggregate data on hiring, quits and layoffs can be misleading. Even so, the very different patterns for people 16-24 and 25-54 may suggest that the recession and lack of recovery have more than one cause.

Article source: http://feeds.nytimes.com/click.phdo?i=8b89bed5689380d7d68af8453c8ae341

Republicans Attack on Handling of Stimulus Money and Green Jobs

“A green jobs fueled recovery is a theory, and is yet unproven,” declared the chairman of the House Oversight and Government Reform committee, Darrell Issa, Republican of California. “There is a lot more green, in the way of cash, and a lot less energy and jobs than anticipated.”

The title of the hearing was, “How Obama’s Green Energy Agenda is Killing Jobs,” a title that one Democratic member, Mike Quigley, Democrat of Illinois, complained was a “raw partisan assertion that presupposes the answer.”

But in between rounds of jousting, the hearing sometimes touched on some of the difficulties of defining and measuring green jobs. Keith Hall, the director of the Bureau of Labor Statistics, which got money last year to start counting green jobs, testified that companies that produce both “green and nongreen outputs” had problems counting the green jobs.

Republican members of the committee and the Democratic witnesses, including Hilda L. Solis, the Secretary of Labor, tangled on whether, for example, a worker who was trained to drive a hybrid bus qualified as holding a green job.

“What makes driving a hybrid bus a green job and driving another bus that’s not a hybrid bus not a green job?” asked Connie Mack, Republican of Florida. “Driving a bus is driving a bus, right?”

Ms. Solis replied, “the vehicles that are built there are green buses, they are fuel efficient.”

Mr. Mack replied, “but this is the bus driver. If I’m sitting in a chair that was made out of green material, does that make my job green?”

But further discussion clarified that the driver of the ordinary bus also had a “green job,” because all mass-transit workers fit the definition of a green job as they provided “services that benefit the environment.”

Ms. Solis reviewed the status of a $500 million program financed under the stimulus bill to train workers for green jobs. About 52,000 people have been trained and the total will reach 96,000, she said.

But Jason Chaffetz, Republican of Utah, pointed out that most of those trained already had jobs (“incumbent workers,” the government calls them) and that only about 6,200 had gotten jobs classified as green, at a cost of roughly $80,000 per job. And some of the jobs, he said, were in overhead line construction and automotive technologies. “These don’t sound quite as green,” he said.

Ms. Solis said giving new skills to people who already had jobs would help them keep their jobs and earn more money. She said in testimony that the country must “out-educate, out-innovate, and out-build our global competitors.”

Like the Obama administration, the committee cited a close link between carbon dioxide emissions and economic health, but in the opposite direction. While President Obama has warned about the long-term threat of global warming and the need to wean the nation from fossil fuels, the committee’s report said, “by sacrificing domestic carbon-based resources upon the altar of an ill-fated “green energy” experiment, the president has put U.S. economic security in jeopardy and wasted billions in taxpayer money at a time when our fiscal health is in peril.”

But Elijah E. Cummings, the ranking Democrat on the committee, said that there was “not one scintilla of evidence” that green policies had cost any jobs.

The Obama administration was on the defensive well before the hearing began. It posted a video on the Energy Department’s Web site, energy.gov, of a newly hired worker in a Michigan battery factory, built in part with a government grant. The worker, a middle-aged woman in safety glasses and a hair net and dressed in industrial coveralls, gets teary as she says, “it took a long time” to get a new job.  Also on the page is a map showing where stimulus money was spent in search of a green economy.

The committee’s Democratic minority circulated an article from Bloomberg News that quoted from two letters Mr. Issa wrote to the energy secretary, urging support for an electric car manufacturer and a battery manufacturer in his district. He wrote that the battery plant would create a “green collar” work force.

After the hearing, Mr. Issa said, “members of Congress will always ask for money from whatever pot to help their constituents.” But he had not asked for any shortcuts in the competition to find the best place for federal dollars, he said. Solyndra, he and other Republicans maintain, was chosen for the loan for political reasons.

Mr. Issa complained that “green jobs” effort was “a political rallying cry aimed to unite environmentalists and union leaders” to promote an ideological agenda.

“This would be O.K. if it produced the jobs, but it didn’t,” he said.

The Bureau of Labor Statistics is supposed to produce a report on that question in March.

Article source: http://feeds.nytimes.com/click.phdo?i=c2662b72340420406a1dbe48751da5d6

Economix Blog: Fewer Americans Quitting Jobs, U.S. Survey Shows

With so much uncertainty about the economy, Americans appear reluctant to quit their jobs, a new Labor Department report shows.

CATHERINE RAMPELL

CATHERINE RAMPELL

Dollars to doughnuts.

Each month the Labor Department releases a number called the “quits rate,” which is the total number of voluntary separations by employees, as a percent of all employment. When the economy is good, the rate tends to be higher, since workers know they have opportunities elsewhere if they don’t like their current jobs.

As you might imagine, the quits rate fell drastically during the recession and even during the early part of the recovery. In December 2007, the month the downturn officially started, the quits rate was 2 percent. By January 2010, it had fallen to about half that, at 1.1 percent.

DESCRIPTIONSource: Bureau of Labor Statistics

The rate has risen slightly since then. As of July, it was 1.5 percent, where it’s been for several months. But that is still well below healthy levels.

In case there’s any doubt, the quits rate hasn’t stagnated because employed Americans are happier at their jobs. A recent Gallup survey suggested that, if anything, workers are more dissatisfied with many aspects of their jobs now than they were in August 2008.

People are reluctant to quit because employers aren’t hiring. And unfortunately, part of the reason that employers aren’t hiring is that their workers aren’t leaving and creating new openings.

Article source: http://feeds.nytimes.com/click.phdo?i=9e3928b9cc027cf5a0282e8ab5b9b8e5

Economix: Still Playing Catch-Up, Across the Economy

Given that the downturn began nearly four years ago, and that the population has grown significantly since then, the economy should instead be bigger than it was before the financial crisis. But Calculated Risk, a finance blog, makes a good observation: On most major measures of economic health, the economy is still worse today than it was before the recession began.

CATHERINE RAMPELL

CATHERINE RAMPELL

Dollars to doughnuts.

Here’s a chart I’ve put together showing the percentage changes in several important economic indicators since the start of the recession in December 2007. The categories are: overall economic growth (gross domestic product), jobs (nonfarm payrolls), personal income (without transfer payments from the government, like unemployment benefits), the length of the workweek, personal spending, and industrial production.

Source: Bureau of Labor Statistics, Federal Reserve, Bureau of Economic Analysis, all via Haver Analytics

As you can see, all of these categories but one are still below where they were when the recession began. Industrial production is by far the worst off, since an index of this activity is nearly 8 percent below its level in December 2007. Second-worst is employment; today there are 5 percent — or about seven million — fewer payroll jobs than there were when the recession began.

Inflation-adjusted personal income and gross domestic product are still below the last business cycle peak, as is the average work week.

The one major indicator shown that is (barely) above its level at the start of the recession is inflation-adjusted consumer spending. Much of that growth has been subsidized by government transfer payments, however. And to further rain on this parade, remember that if the economy were healthy, consumer spending would probably be much higher today than it was before the recent recession. Just take a look at the longer-term trend:

Source: Federal Reserve Bank of St. LouisFigures on left axis are expressed in “chained” dollars — inflation-adjusted, in 2005 dollars.

Article source: http://feeds.nytimes.com/click.phdo?i=3cb3379491255cf19144e88efffae5ae