
CATHERINE RAMPELL
Dollars to doughnuts.
Despite all the talk of the lazy 47 percenters, the scruffy 99 percent versus the entitled top 1 percent, contentious proposals to raise taxes on the rich, and the uncapped political donations of billionaires, the “class war” apparently abated last year, if you believe the American public.
 Based on two surveys by the Pew Research Center. The latest survey is a telephone poll conducted Nov. 28 to Dec. 5, 2012, with a nationally representative sample of 2,511 adults ages 18 and older. Margin of sampling error is plus or minus 2 percentage points. The previous survey was conducted Dec. 6-19, 2011, with a nationally representative sample of 2,048 adults ages 18 and older. Margin of sampling error is plus or minus 3 percentage points.
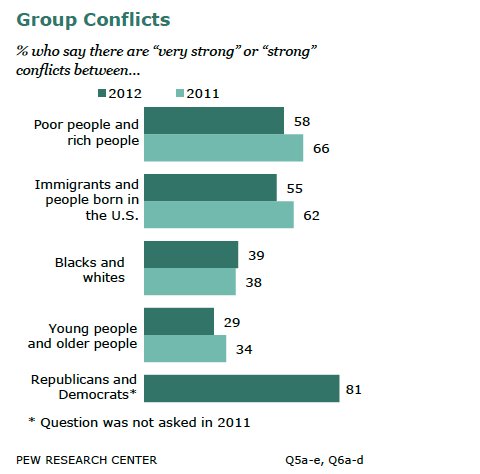
Asked by Pew Research Center about conflicts between rich and poor, Americans were less likely to say there were “strong” or “very strong” conflicts at the end of 2012 than they were a year earlier. In 2012, 58 percent of Americans believed there were significant conflicts between rich and poor, compared with 66 percent in 2011. The biggest conflict Americans perceived was along partisan lines, not economic ones.
Here are the numbers from previous years Pew asked about conflicts between rich and poor, showing that Americans perceive about as much class warfare today as they did in 1987:
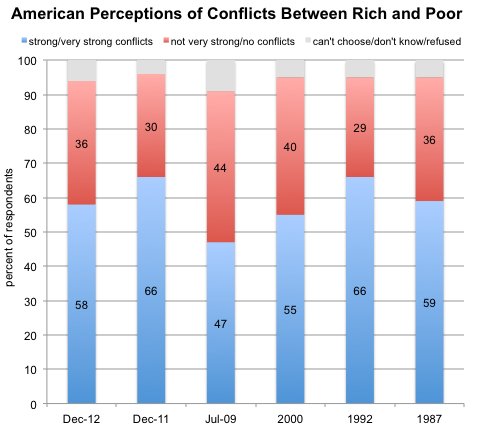 Source: Pew Research Center. Latest numbers are from a survey conducted Nov. 28 to Dec. 5, 2012, with a nationally representative sample of 2,511 adults ages 18 and older and a margin of sampling error of plus or minus 2 percentage points.
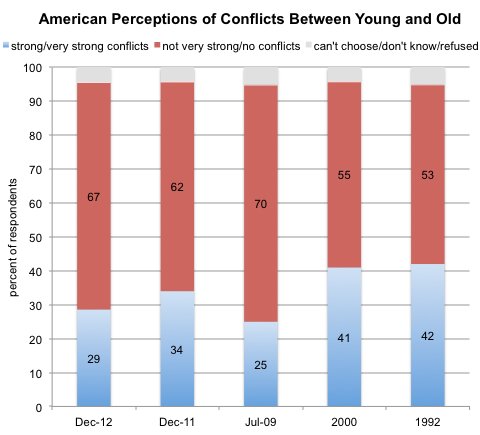
There was no statistically significant change in perceived conflicts between the young and the old (29 percent in 2012 versus 34 percent in 2011). Perceived conflicts between these two age groups is actually relatively low compared to some of previous years for which Pew has data:
 Source: Pew Research Center. Latest numbers are from a survey conducted Nov. 28 to Dec. 5, 2012, with a nationally representative sample of 2,511 adults ages 18 and older and a margin of sampling error of plus or minus 2 percentage points.
From an economic standpoint, it’s actually a bit surprising that Americans don’t see greater tensions between the generations. Medicare and other public spending on the elderly (such as public pensions at the state level) has been gobbling up an increasing share of government budgets, which crowds out spending on the young and raises their future tax burdens.
Article source: http://economix.blogs.nytimes.com/2013/01/11/so-much-for-the-growing-class-war/?partner=rss&emc=rss

