April 23, 2024

Housing Recovery Seems Still on Track

For now, though, builders are building, sellers are selling and mortgage lenders are less nervous about extending credit to buyers.

The heady price increases in the first half of the year slowed a bit in July, according to data released on Tuesday.

But in the face of pent-up demand and emboldened consumers, home values were still heading upward at a healthy pace, rising 12.4 percent from July 2012 to July 2013, according to the Standard Poor’s Case/Shiller home price index, which tracks sales in 20 cities.

A separate index of mortgages backed by Fannie Mae and Freddie Mac showed an 8.8 percent gain in prices over the same time period.

Two national homebuilders, Lennar and KB Home, reported significant revenue growth and profits in the third quarter. Lennar said its third-quarter earnings rose 39 percent over the third quarter of last year, and KB said its profit had increased sevenfold.

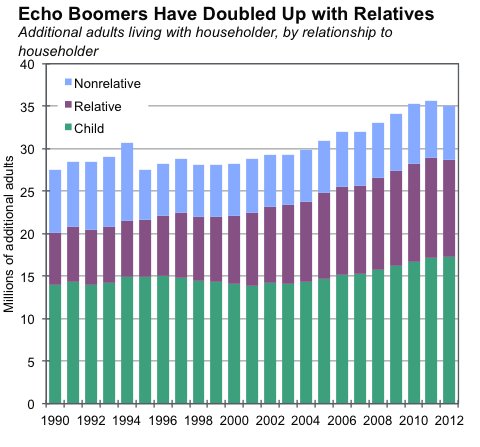
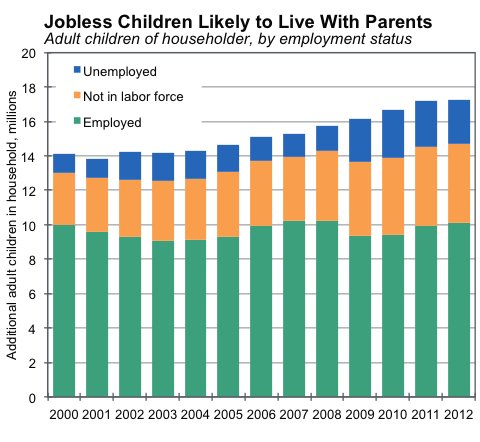
“We still have a lot of young people that are going to start moving out and forming households and we’re going to have to find housing for them,” said Patrick Newport, the chief United States economist for IHS Global Insight. “There are shortages of homes just about everywhere.”

Higher home prices help the economy not just by strengthening the construction and real estate industries, but by making homeowners feel wealthier and more likely to spend.

While the number of Americans who lost the equity in their homes in the housing crash set records, rebounding prices have helped nudge more and more households back above water. According to CoreLogic, 2.5 million households regained equity in their homes in the second quarter.

Mr. Newport said the full effects of higher mortgage rates had probably not shown up in the numbers yet.

Rates increased from about 3.4 percent on 30-year fixed-rate loans in January to about 4.4 percent in July, according to a survey by Freddie Mac, and many loans were written at even higher rates this summer. But they remain well below typical rates in recent decades, and mortgage borrowing costs have already eased a bit from their recent peak now that the Federal Reserve opted last week not to begin a wind-down of stimulus measures.

Rising rates may not torpedo the housing market recovery, but they have made refinancing much less appealing.

The number of mortgage applications for purchases has climbed by 7 percent over the last year, according to the Mortgage Bankers Association, but refinance requests have fallen by 70 percent since early May.

As a result, banks have laid off thousands of workers in their mortgage units. Citigroup laid off 1,000 workers from its mortgage business, it said on Monday, following Wells Fargo and Bank of America, which have both done layoffs in recent months.

Refinancing also gave households more spending power as it lowered monthly payments.

Analysts offered a cornucopia of reasons for the continuing strength of the housing market: people rushing to buy before prices and interest rates increased further, a gradual relaxation of lending standards, an uptick in inventory, a smaller share of foreclosures in the sales stream and large-scale buying by investors looking to put houses on the rental market.

Still, some analysts questioned whether fundamental factors like job and wage growth would sustain the market and restore first-time buyers to the market. Others warned of a lurking shadow inventory.

“While recent results have been considerably better than those seen earlier in the cycle, and also better than we had anticipated, we have not given up on the argument that a large supply overhang of existing homes (factoring in all those in foreclosure or soon to be) promises to keep pressure on prices for some time,” Joshua Shapiro, the chief United States economist for MFR, wrote in a note to investors.

Once the backlog of demand is absorbed, continued strength will depend heavily on consumer confidence. That’s where politics, including a looming battle over federal spending and the debt ceiling, could stall improvement.

“The real test will come over the next few months, given the sharp drop in mortgage demand and the potential for a rollover in consumers’ confidence as Congress does its worst,” wrote Ian Shepherdson, an economist with Pantheon Macroeconomics.

On Tuesday, the Conference Board, a New York-based private research group, reported that Americans’ confidence in the economy fell slightly in September from August, as many became less optimistic about hiring and pay increases over the next six months. The September reading dropped to 79.7, down from 81.8 the previous month, but remained only slightly below June’s reading of 82.1, the highest in five and a half years.

Year-over-year prices were up in all 20 cities tracked by Case/Shiller, but the gains varied widely, from 3.5 percent in New York and 3.9 percent in Cleveland on the low end to a frothy 24.8 percent in San Francisco and 27.5 percent in Las Vegas.

The month-to-month increase in the Case/Shiller index slowed to 0.6 percent, after gains of 1.7 percent in April, 0.9 percent in May and 0.9 percent in June.

Asked if the slowdown in growth was alarming, Robert Shiller, the Yale economist who helped develop the home price index, said no. “I’m not worried,” he said in an interview with CNBC. “I think that would be a good thing.”

His greater worry, he said, was “more about a bubble — in some cities, it’s looking bubbly now.”

Still, Mr. Shiller said, even the bubbliest markets were still well below their peak.

Other analysts raised the same point. Prices in San Francisco are still only at 2004 levels, cautioned Steve Blitz, chief economist for ITG Investment Research. “For those who bought and still hold homes in 2005, ’06 and ’07, they may still be in a negative equity position, depending on the terms of their mortgage,” Mr. Blitz wrote. “Don’t let those double-digit year-over-year percentage gains bias opinion to believe all is all right.”

This article has been revised to reflect the following correction:

Correction: September 25, 2013

An earlier version of this article omitted a credit for several remarks from Mr. Shiller. He made his comments in an interview with CNBC, not with The Times. 

Article source: http://www.nytimes.com/2013/09/25/business/economy/home-prices-still-rising-but-at-slower-pace.html?partner=rss&emc=rss

Germans Are Poor and Italians Are Frugal. Huh?

FRANKFURT — The Italians are the most prudent people in Europe. Spaniards and Greeks are not as badly off as their homelands’ dismal economic statistics would suggest. And pity the Germans. They are poorer than the Cypriots they are helping to bail out.

Taken at face value, those are some of the surprising findings of an extensive survey of household debt and wealth conducted by researchers for the European Central Bank and published Tuesday.

But the first-ever survey, designed to promote better monetary policy by filling a major gap in knowledge about household finances in the euro area, came laden with caveats. Much of the data are several years old and it could be risky to draw too many conclusions.

For example, the data may make some countries appear richer than they really are, the E.C.B. study warned, because of differences in the number of people typically sharing a home and other factors. Cypriots have some of the largest households in the euro area, while Germans, on average, have the smallest. The survey of 62,000 households measured wealth, income and debt for households, not individuals, so a country with larger families living together might appear wealthier.

As a result, the figures should be “interpreted with caution,” the E.C.B. report said.

In addition, fewer than half of German households own their homes, in part because it is one of the few countries in the euro zone that does not grant a tax deduction for mortgage interest payments. Since homes tend to be Europeans’ most valuable asset by far, the prevalence of renters makes Germans appear to have less net wealth than otherwise hard-pressed Spaniards. The rate of home ownership in Spain is more than 80 percent.

The average net wealth of households in Spain is €291,000, or $380,000, compared with €195,000 for Germany. But it would be hard to argue that Spain, with official unemployment of 26 percent, is better off than Germany, with a rate of 5.4 percent.

And despite average net wealth of €671,000 per household, few would envy the Cypriots, whose banking system is in ruins and where the economy may be headed into severe recession. Wealth in Cyprus is also concentrated among a relatively small group.

Interviewers began collecting the data as early as 2009, so they do not capture most of the severe economic decline that has since taken place in countries like Greece, Spain and Portugal. In addition, survey participants were asked to estimate the value of their homes and might not have been accurate in countries like Spain where there have been huge declines in real estate values. The survey contains no data for two of the 17 members of the currency union: Ireland and Estonia.

But the survey does suggest that differences in standards of living in the euro area may not be as great as they are often assumed to be.

The survey challenges some other stereotypes as well. Although the Italian government suffers from a reputation for frivolous spending and dysfunctional politics, Italian households are the least likely in the euro zone to borrow money. About 75 percent of Italian households have no debt at all, according to the survey.

The survey could also fuel the sense of injustice among European policy makers when criticized by their American counterparts about their handling of the debt crisis. By coincidence, the study appeared as the U.S. Treasury secretary, Jacob J. Lew, was touring European capitals urging leaders to do more to promote growth.

According to the E.C.B. data, Americans are the ones with too much debt. In the euro area, 44 percent of households have some kind of debt, compared with 75 percent in the United States. In addition, Americans as a group devote a much larger share of their income to paying interest on debt.

The E.C.B. said in a statement that the data would provide a more nuanced view of household finances and promote better monetary policy. For example, the E.C.B. will be able to better calculate the effect of an increase in interest rates on household finances.

“The ongoing and long-lasting economic crisis has made it more evident than ever that large structural imbalances may remain hidden” without such detailed data, the E.C.B. said.

Article source: http://www.nytimes.com/2013/04/10/business/global/germans-are-poor-and-italians-are-frugal-huh.html?partner=rss&emc=rss

Iceland Weighs Exporting the Power Bubbling From Below

While the menacing lava flow has long since stopped and Krafla is today a showcase of Iceland’s peerless mastery of renewable energy sources, another problem that has dogged its energy calculations for decades still remains: what to do with all the electricity that the country — which literally bubbles with steam, hot mud and the occasional cloud of volcanic ash — is capable of producing.

In a nation with only 320,000 people, the state-owned power company, Landsvirkjun, which operates the Krafla facility, sells just 17 percent of its electricity to households and local industry. The rest goes mostly to aluminum smelters owned by the American giant Alcoa and other foreign companies that have been lured to this remote North Atlantic nation by its abundant supply of cheap energy.

Now a huge and potentially far more lucrative market beckons — if only Iceland can find a way to transmit electricity across the more than 1,000 miles of frigid sea that separate it from the 500 million consumers of the European Union. “Prices are so low in Iceland that it is normal that we should want to sell to Europe and get a better price,” said Stein Agust Steinsson, the manager of the Krafla plant. “It is not good to put all our eggs in one basket.”

What Landsvirkjun charges aluminum smelters exactly is a secret, but in 2011 it received on average less than $30 per megawatt/hour — less than half the going rate in the European Union and barely a quarter of what, according to the Renewable Energies Federation, a Brussels-based research unit, is the average tariff, once tax breaks and subsidies are factored in, for “renewable” electricity in the European Union. Iceland would not easily get this top “renewable” rate, which is not a market price, but it still stands to earn far more from its electricity than it does now.

Eager to reach these better paying customers, the power company has conducted extensive research into the possibility of a massive extension cord — or a “submarine interconnector,” in the jargon of the trade — to plug Iceland into Europe’s electricity grid. Such a cable would probably go first to the northern tip of Scotland, which, about 700 miles away, is relatively close, and then all the way to continental Europe, nearly 1,200 miles away. That is more than three times longer than a link between Norway and the Netherlands, which is currently the world’s longest.

Laying an underwater cable from the North Atlantic would probably cost more than $2 billion, and the idea is not popular with those who worry about Iceland — a country that takes pride in living by its own means in harsh isolation — becoming an ice-covered version of Middle East nations addicted to easy money from energy exports.

Backers of the cable “are looking for easy money, but who is going to pay in the end?” said Lara Hanna Einarsdottir, an Icelandic blogger who has written extensively on the potential risks involved in geothermal energy. “We will all pay.”

Iceland, Ms. Einarsdottir said, should use its energy sources to “supply ourselves and coming generations” and not gamble with Iceland’s unique heritage by “building more and more plants so that we can provide electricity to towns in Scotland.”

The idea of somehow exporting electricity to Europe has been around for decades and has been “technically doable for some time,” said Hordur Arnarson, the power company’s chief executive, “but it was not seen as economically feasible until recently.” The change is largely because of a push by the European Union to reduce the use of oil and coal and promote green energy, a move that has put a premium on electricity generated by wind, water and geothermal sources. The union’s 27 member states agreed in 2009 to a mandatory target of deriving at least 20 percent of its energy from “renewable sources” by 2020.

A connection to Europe would not only allow Iceland to tap the export market but also to import electricity from Europe in the event of a crisis, a backup that would allow it to stop keeping large emergency reserves, as it does now.

“This is a very promising project,” Mr. Arnarson said. “We have a lot of electricity for the very few people who live here.” Compared with the rest of the world, he said, Iceland produces “more energy per capita by far, and it is very natural to consider connecting ourselves to other markets.”

Article source: http://www.nytimes.com/2013/02/21/world/europe/iceland-weighs-exporting-the-power-bubbling-from-below.html?partner=rss&emc=rss

French Council Strikes Down 75% Tax Rate on Rich

Prime Minister Jean-Marc Ayrault quickly pledged that the government would reintroduce a revised version of the tax for next year to address the criticisms of the Constitutional Council, which ruled that the measure did not tax affected households equally.

The 75 percent rate was always a symbolic political gesture, as Mr. Hollande himself has acknowledged. It was to expire in two years and would have applied only to annual income above 1 million euros, or about $1.3 million, and so would have affected no more than a few thousand taxpayers.

Tax revenues from the measure would have reached just a few hundred million dollars, little more than a bucket of water in France’s deficit sea; the budget deficit is about $112 billion this year.

The council ruled that the tax was unfair because it would have applied unevenly to different households with the same combined income. A couple making a combined 1.5 million euros a year, for instance, would be exempt from the tax so long as both partners earned less than 1 million euros individually. If one partner earned more than 1 million euros, however, the couple would have been required to pay the 75 percent rate on their combined earnings of more than 1 million.

Mr. Hollande introduced the tax during his presidential campaign — a sharp break from his center-right rival, Nicolas Sarkozy, who had established a tax ceiling of 50 percent of earnings — to prove his leftist credentials in the face of a challenge from a candidate supported by the Communists, Jean-Luc Mélenchon.

Among the opposition on the right, politicians said the 75 percent rate was tantamount to theft, calling it “confiscatory” and insisting that it would drive investors and entrepreneurs out of the country. There have been reports and rumors of as many as 5,000 wealthy French citizens moving out of the country, though there are no official figures.

Most recently, in what has grown into a minor national scandal, it was revealed that the actor Gérard Depardieu would be taking up residence in Belgium, where there is no wealth tax and where the maximum income tax rate is 50 percent.

In France, without the 75 percent tax rate, the highest income tax rate will now be 45 percent. (With the invalidation of the 75 percent rate, French Twitter users have implored Mr. Depardieu to return to France, some facetiously, some not.) The 45 percent rate, which will apply to income above 150,000 euros, or about $198,000, is itself an increase from the previous top rate of 41 percent.

The Constitutional Council approved the increase in its ruling Saturday, along with several general elements of the government’s planned budget for next year: an increase in tax withholdings, the taxing of capital gains at the same rates as income tax and a rise in the wealth tax rates.

It invalidated a proposed 75 percent tax on complementary retirement pensions, however, calling it “confiscatory.” The council reduced the rate to 68 percent.

Mr. Hollande has committed to cutting France’s budget deficit, which stood at 4.5 percent of gross domestic product this year, to 3 percent next year. But he has emphasized tax increases rather than spending cuts. To meet the target, Parliament this month approved a spending freeze that would save about $13 billion, along with $26 billion in additional tax revenues — including those meant to come from the 75 percent rate — for the 2013 budget. But the budget was drawn up on the basis of the government’s growth estimate of 0.8 percent, a number viewed by many economists in France and elsewhere as unrealistically high.

Article source: http://www.nytimes.com/2012/12/30/world/europe/french-council-strikes-down-75-tax-rate-on-rich.html?partner=rss&emc=rss

Consumer Borrowing Rises to $2.75 Trillion

The agency said consumers increased their borrowing by $14.2 billion in October from September. Total borrowing rose to a record $2.75 trillion.

Borrowing in the category that covers autos and student loans increased by $10.8 billion. Borrowing on credit cards rose by $3.4 billion, only the second monthly increase in the last five months.

The increase in borrowing came in a month when Americans cut back on consumer spending, reflecting in part disruptions from Hurricane Sandy.

Many consumers may also have scaled back because of fears about the automatic tax increases and spending cuts that will take effect in January if Congress and the Obama administration fail to reach a budget deal by then.

Consumer spending drives about 70 percent of the nation’s economic activity.

Economists think that it could bounce back. But the underlying trend remains weak because with unemployment remaining high, households don’t have the income to spend.

Consumers are also signaling concern. A survey of consumer sentiment, the Thomson Reuters/University of Michigan survey, fell sharply in December, economists noted, partly over worries that taxes could rise next year.

Many consumers have been reluctant to build up credit card debt, which typically carries steeper interest rates than other loans.

Credit card use has fallen sharply since the 2008 credit crisis. Four years ago, Americans had $1.03 trillion in credit card debt. In October, that figure was 17 percent lower.

During the same period, student loan debt rose. The category that includes auto and student loans is 22 percent higher than in July 2008. That reflects in part the decision by many Americans who have lost jobs to return to school to get training for new careers.

Article source: http://www.nytimes.com/2012/12/08/business/economy/consumer-borrowing-rises-to-2-75-trillion.html?partner=rss&emc=rss

Economix Blog: Bundled Households

As I wrote on Friday, lots of young Americans are finally moving out of their parents’ basements and forming their own households now that the economy is picking up. But the bundled-household phenomenon remains large, and Mark Zandi, chief economist at Moody’s Analytics, has just shared some interesting data showing its extent.

Based on demographics and previous trends in household formation, it looks as if the country still has about 1.8 million fewer households today than it would have in a more “normal” economy, and most of that total household deficit is accounted for by the lower numbers of households formed by those in the 15-34 age group. Demographics suggest that there should be about 1.1 million more households headed by younger Americans today than there actually are.

As a result, we’re still see an unusually high number of people living with parents, other relatives or friends.

This chart shows the total number of additional adults living with a home’s official householder, broken down by the relationship to the householder: nonrelative, child or other relative.

Sources: Census Bureau, IPUMS USA, University of Minnesota, Moody’s Analytics. Sources: Census Bureau, IPUMS USA, University of Minnesota, Moody’s Analytics.

As you can see there are about 17.2 million adult children living in their parents’ homes this year, compared with around 15.3 million in 2007, the year the recession began.

Mr. Zandi has also broken out the employment status of those adult children crashing with their folks. And the numbers show that the greatest increases are accounted for by unemployed adult children who have moved in with parents.

Sources: Census Bureau, IPUMS USA, University of Minnesota, Moody’s Analytics. Sources: Census Bureau, IPUMS USA, University of Minnesota, Moody’s Analytics.

In 2007, 1.3 million unemployed adult children were living in their parents’ homes. This year, the total is about 2.5 million.

Article source: http://economix.blogs.nytimes.com/2012/11/12/bundled-households/?partner=rss&emc=rss

Economix Blog: Casey B. Mulligan: When Times Get Tough, the Elderly Work

Casey B. Mulligan is an economics professor at the University of Chicago.

The elderly are one group whose work hours now exceed what they were before the recession began. This pattern is most evident in the most depressed regions of the United States.

Today’s Economist

Perspectives from expert contributors.

The recession has varied in different regions of the United States. In some areas – including Arizona, California, Florida, Hawaii, and Nevada – housing prices surged more dramatically in the early part of the 2000s than they did in the rest of America, and their economies fell hard when housing prices collapsed.

One view is that such areas experienced a deeper recession because their banks became overwhelmed with defaults and were unable or unwilling to make new loans to consumers and businesses. Without those new loans, demand collapsed more than it did nationwide, and jobs were especially difficult to find, even while people living in the area were especially eager to work.

Absent demand, just about all workers will have a tough time retaining a job or finding a new one.

Another view is that old loans are the problem, not newer ones. A significant fraction of households and businesses are typically so burdened with the debts they accumulated during the housing surge that they have little incentive to produce and work, because their creditors would get most, if not all, of the fruits of their labor.

In contrast to the no-new-loans-and-no-demand theory, old loans do not affect all workers; some are less burdened by debt. The elderly may fall in this category, because they are more likely to have saved money over their lifetimes and to have paid off their mortgages. Although some elderly working for debt-burdened employers may have lost jobs, on average the elderly in these areas should be working more because they have better incentives to do so.

The chart below compares 2007-10 changes in work hours for two areas –- the regions where housing prices rose and fell the most, on the left side of the chart, and the rest of the United States on the right. For middle-aged and younger people (blue bars), hours worked fell 12 percent in the large cycle regions and about 9 percent in the rest of the United States.

Hours worked by elderly people increased in both regions.

As I noted a few weeks ago, the average American elderly person worked more in 2010 than did the average elderly person before the recession began, even while work hours were down sharply for middle-aged and young people. The chart above shows that this is true even in the states that generally experienced the largest collapse during this recession.

Demand is not the only factor driving employment patterns.

Article source: http://feeds.nytimes.com/click.phdo?i=a6b1f9ed4fb70bf8c2554795faa4e60c

Off the Charts: Debt Numbers Alone Tell Little About Fiscal Stability

But looking only at government debt totals can provide a misleading picture of a country’s fiscal situation, as can be seen from the accompanying tables showing both government and private sector debt as a percentage of gross domestic product for eight members of the euro zone. The eight include the largest countries and those that have run into severe problems.

In 2007, before the credit crisis hit, an analysis of government debt would have shown that Ireland was by far the most fiscally conservative of the countries. Its net government debt — a figure that deducts government financial assets like gold and foreign exchange reserves from the money owed by the government — stood at just 11 percent of G.D.P.

By contrast, Germany appeared to be in the middle of the pack and Italy was among the most indebted of the group.

Yet Ireland was slated to become one of the first casualties of the credit crisis, and is now among the most heavily indebted. Germany is doing just fine. Italian debt has risen only slowly. The I.M.F. forecasts that Ireland’s debt-to-G.D.P. ratio will be greater than that of Italy by 2013.

It turned out that what mattered most in Ireland was private sector debt. As the charts show, debts of households and nonfinancial corporations then amounted to 241 percent of G.D.P., the highest of any country in the group.

“In Ireland, as in Spain, the government paid down debt while private sector grew,” said Rebecca Wilder, an economist and money manager whose blog at the Roubini Global Economics Web site highlighted the figures this week. She was referring to trends in the early 2000s, before the crisis hit.

Much of the Irish debt had been run up in connection with a real estate boom that turned to bust, destroying the balance sheets of banks. The government rescued the banks, and wound up broke. Spain has done better, but it, too, has been badly hurt by the results of a real estate bust.

The story was completely different in the Netherlands, which in 2007 ranked just behind Ireland in apparent fiscal responsibility. It also had high private sector debt, but most of those debts have not gone bad.

The differences highlight the fact that debt numbers alone tell little. For a country, the ability of the economy to generate growth and profit, and thus tax revenue, is more important. For the private sector, it matters greatly what the debt was used to finance. If it created valuable assets that will bring in future income, it may be good. Even if the borrowed money went to support consumption, it may still be fine if the borrowers have ample income to repay the debt.

That is one reason many euro zone countries are struggling even with harsh programs to slash government spending. With unemployment high and growth low — or nonexistent — it is not easy to find the money to reduce debts. And debt-to-G.D.P. ratios will rise when economies shrink, even if the government is not borrowing more money.

Floyd Norris comments on finance and the economy at nytimes.com/economix.

Article source: http://feeds.nytimes.com/click.phdo?i=76ed74e70982a1839c709bd608bf8328

Economix: A Chart to Explain Confusion on Jobs

11:27 a.m. | Updated If you are confused about today’s jobs report — job growth was up in April, but so was the unemployment rate — the chart below may help.

The Labor Department does two different surveys of the job market, as I mentioned in an earlier post. A survey of employers produces the estimate of job growth. A survey of households produces the unemployment rate.

Since the recession began, the survey of households has been offering a more optimistic picture of the labor market than the survey of employers. That’s why the blue line in the chart is above the red line: the blue line — which represents the household survey — shows less job loss. The chart begins when the recession did, in December 2007.

Average monthly employment change since December 2007.Bureau of Labor Statistics, via Haver AnalyticsAverage monthly employment change since December 2007.

But now look at the very end of the chart. Do you see how the blue line dips, leaving it closer to the red line? That is today’s jobs report. It doesn’t mean unemployment actually rose last month.

There is still a dark lining here, as that earlier post mentioned. During economic recoveries, the household survey is typically more optimistic than the employer survey — and typically more accurate, too, in part because the employer survey misses jobs created by start-up firms. Over the past three and a half years, the household survey has again been more optimistic. But we learned this morning that it may not have been much more accurate.

Update: Some readers have asked whether the unemployment rate can rise even as employment is growing because more people start looking for work — and thus count as officially unemployed. Theoretically, the answer is yes. This does happen sometimes. But it didn’t happen in April. The unemployment rate rose last month because the household survey showed a decline of 190,000 jobs, not because of a surge in job seekers. That’s why there is no way to reconcile last month’s results of the household survey and employer survey. They make sense only in the context of previous months.

Article source: http://feeds.nytimes.com/click.phdo?i=1c612f0ffc7d89f8f693dd6e863db1f1

Youth, Mobility and Poverty Help Drive Cellphone-Only Status

At the other extreme? People in Rhode Island, Connecticut and New Jersey are still holding on to their landlines, and they have the lowest concentrations of people whose homes use only cellphones.

The study, released Wednesday, was part of an annual survey conducted by the National Center for Health Statistics. Information from interviews was blended with census data to draw a map of cellular-only use by state.

Its findings reflect patterns of consumer behavior that are driven by age, mobility and, in a strange twist, poverty. According to Stephen Blumberg, the researcher who conducted the study, nearly 40 percent of all adults living in poverty use only cellphones, compared with about 21 percent of adults with higher incomes.

There appear to be many reasons for this. Cellular phones have become more affordable. The barrier to owning one is lower with pay-as-you-go plans. Some states allow subsidies for low-income residents to be applied to wireless bills. And increasingly, those who cannot afford both types of phones choose their cellular phone.

It is, of course, a long way from the days when cellphones belonged exclusively to wealthy business people. In fact, the wealthiest areas — New England, New York, California — had some of the lowest concentrations of cellular-only households.

Rhode Island and New Jersey were the lowest at 12.8 percent of adults and children in cellular-only households. Just above was Connecticut at 13.6. New York was at 17 percent and California at 18 percent.

By contrast, Arkansas had the highest concentration of people in cell-only households, at 35.2 percent. Next was Mississippi at 35.1 percent, Texas at 32.5 percent, North Dakota at 32.3 percent, Idaho at 31.7 percent and Kentucky at 31.5 percent.

Those who were more nomadic were more likely to use only cellular phones. Forty-seven percent of renters were wireless-only, compared with 15 percent of owners, Mr. Blumberg said.

Age is another important factor. Forty-four percent of people between the ages of 18 and 30 are cellular-only users, compared with just 18 percent of those 31 and older, Mr. Blumberg said.

Some of the places with the lowest concentrations of cellular-only households were also the oldest. According to Andrew A. Beveridge, a sociology professor at Queens College, Connecticut was the seventh-oldest state in the country by median age in 2009, Rhode Island was the eighth and New Jersey was the 11th.

“It would not surprise me if that phrase ‘home telephone number’ goes the way of rotary dial telephones and party lines,” Mr. Blumberg said. “Instead of teaching a child a home phone number, the child will be taught Mom’s number and Dad’s number and Grandma’s number.”

California seemed to be an exception to the rule. It had one of the lower concentrations of cellular-phone only households, even though its median age makes it the sixth youngest state, according to 2009 census data.

James E. Katz, director of the Center for Mobile Communication Studies at Rutgers University, said one reason could be the generous subsidies the state gives low-income residents for local calling on landlines.

While some states participate in a plan that allows subsidies to be applied to cellular service, California does not, something that masks what would otherwise be much higher rates of cellphone-only households, Dr. Katz said.

Another factor appeared to be the prevalence of landlines. In 2000, Mississippi was No. 2, after Puerto Rico, for the portion of residents who did not have a home phone, according to census data. Arkansas was No. 4. In both states, the number was less than 7 percent of all households.

Robert Gebeloff contributed reporting from New York.

Article source: http://feeds.nytimes.com/click.phdo?i=b9e0142c0aab4721a5ab6fddce42711a