CATHERINE RAMPELL
Dollars to doughnuts.
Periodically I am asked whether we should worry about inflation, given how much money the Federal Reserve has pumped into the economy. Based on the Bureau of Economic Analysis data released Friday morning, this answer is still emphatically no.
The personal consumption expenditures, or P.C.E., price index, which the Fed has said it prefers to other measures of inflation, fell from March to April by 0.25 percent. On a year-over-year basis, it was up by just 0.74 percent. Those figures are quite low by historical standards, and helped push consumer spending up. (Measured in nominal terms, consumer spending fell slightly in April. After adjusting for inflation, it rose.)
When looking at price changes, a lot of economists like to strip out food and energy, since costs in those spending categories can be volatile. Instead they focus on so-called “core inflation.” On a monthly basis, core inflation was flat. But year over year, this core index grew just 1.05 percent, which is the lowest pace since the government started keeping track more than five decades ago.
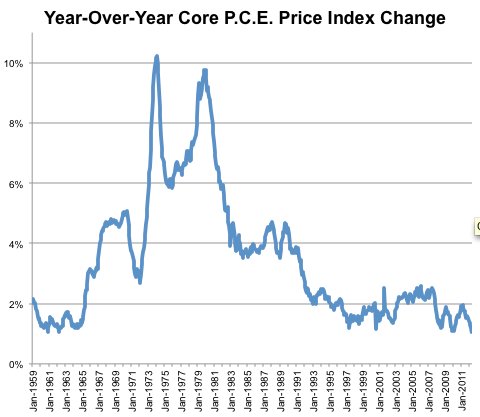 Source: Bureau of Economic Analysis, via Haver Analytics. The core P.C.E. price index refers to the price index change for personal consumption expenditures, excluding food and energy.
Low inflation may be one reason that consumers have proven so resilient in recent months (in addition to the lift they’re getting from rising home prices). A measure of consumer sentiment released Friday by the University of Michigan surged in May, and is at its highest level since July 2007.
Article source: http://economix.blogs.nytimes.com/2013/05/31/little-cause-for-inflation-worries/?partner=rss&emc=rss