November 22, 2024

Economic Data Shows Weak Gains

The survey, from the payroll provider ADP, found that May’s gain was above April’s revised total of 113,000 but much lower than the gains ADP reported over the winter. Those numbers averaged more than 200,000 a month from November through February.

Productivity rose at a seasonally adjusted annual rate of 0.5 percent in the first quarter, after a 1.7 percent decline in the October-to-December period, the Labor Department said on Wednesday. With productivity growth slow, companies might have to add workers if demand for their products continues to grow.

The first-quarter performance was revised down slightly from an initial estimate of a 0.7 percent first-quarter increase. The revision reflected the fact that the government lowered its estimate of overall economic output in the first quarter to a rate of 2.4 percent, from 2.5 percent. Productivity is the amount of output per hour of work.

Labor costs actually fell in the January-to-March quarter, dropping at an annual rate of 4.3 percent after having surged at an 11.8 percent rate in the fourth quarter.

The trend in productivity has been fairly weak in recent years. For all of 2012, productivity rose just 0.7 percent, after an even smaller 0.6 percent rise in 2011.

Those gains were less than half the average growth in 2009 and 2010, shortly after many companies laid off workers to cut costs during the recession. And it is below the long-run trend of 2.2 percent annual growth in productivity dating to 1947.

But most economists say they expect higher Social Security taxes have started to weigh on consumers. That should slow economic growth in the second and third quarters.

The ADP survey is derived from payroll data and tracks private employment. It has diverged at times from the government’s more comprehensive monthly jobs report, which will be released on Friday. In April, the government said private employers added 176,000 jobs, much higher than the ADP’s estimate.

Economists say the gap between the ADP survey and the government figures has narrowed since Moody’s Analytics began compiling the numbers eight months ago. Still, it has differed from the Labor Department’s report by about 40,000 a month since then.

“The ADP survey has never been the most reliable indicator,” Paul Ashworth, an economist at Capital Economics, said in a note to clients.

Economists forecast that the government’s report will show employers added 170,000 jobs in May, according to a survey by FactSet. The unemployment rate is expected to stay at a four-year low of 7.5 percent.

Most economists said the ADP report would not prompt them to change their forecasts.

The ADP report found that manufacturing companies cut 6,000 jobs last month. Construction firms added only 5,000, below the previous month’s 15,000 gain, and retail hiring has also been weak.

Article source: http://www.nytimes.com/2013/06/06/business/economy/economic-data-shows-weak-gains.html?partner=rss&emc=rss

I.P.O.’s Set for Hong Kong Raise Hopes for Revived Activity

HONG KONG — A unit of Sinopec Group and the brokerage firm China Galaxy Securities are introducing initial public offerings in Hong Kong on Monday, seeking to raise a total of as much as $3.5 billion.

Sinopec Engineering, a unit of Sinopec, the largest Asian oil refiner, is offering 1.33 billion shares in an indicative range of 9.8 Hong Kong dollars to 13.1 dollars each, putting the deal value as high as 17.4 billion dollars, or $2.24 billion, two people close to the deal said Sunday.

At the top end, the deal would be the largest I.P.O. in Hong Kong since People’s Insurance Co. of China raised $3.56 billion in late November.

The offer values Sinopec Engineering at 9 to 12 times its forecast earnings in 2013, said the people close to the deal, who declined to be identified because details of the deal were not yet public.

Meanwhile, China Galaxy Securities, whose larger rivals include Citic Securities and Haitong Securities, is offering about 1.5 billion shares in an indicative range of 4.99 dollars to 6.77 dollars each, the people said. The range is equivalent to a price-to-book ratio of 1.19 to 1.49 times. The ratio is used to compare a company’s book value with its current market price.

The company had planned for a dual listing in Shanghai and Hong Kong, but gave up plans for a simultaneous offering in mainland China after the country’s securities regulator froze I.P.O. approvals late last year.

Such large I.P.O.’s have been eagerly anticipated in Hong Kong and their success could set off a wave of other deals in coming months involving companies like hotel operators and banks looking to sell new shares.

The two deals underscore a pickup in activity after I.P.O. issuance in Asia outside of Japan plunged 56 percent to $3.3 billion in the first quarter, making it the worst start to a year for new share listings since the first quarter of 2009, according to Thomson Reuters data.

I.P.O.’s in Hong Kong are down 20 percent so far in 2013 from the same period of 2012, to $1.05 billion, data show. After being a global I.P.O. hub for several years, the city had only $7.72 billion worth of deals in 2012, the lowest volume since the 2008 global financial meltdown.

Hong Kong’s lackluster performance is in sharp contrast to Southeast Asia, where a string of deals including BTS Infrastructure Fund and the real estate investment trust Mapletree China, backed by Temasek Holdings, have kept bankers busy.

Other large deals that are likely to be held in Hong Kong this year include a series of commercial real estate spinoffs from Hong Kong property and investment companies, including an I.P.O. by NW Hotel Investments, which is part of New World Development, that could reach $1 billion.

Great Eagle Holdings also plans to spin off its Langham hotel chain through an $800 million I.P.O., while the property and infrastructure group Hopewell Holdings is looking to raise as much as $800 million from a spinning off of its property and hospitality business, Hopewell HK Properties.

Sinopec Engineering was formed last September, consolidating eight engineering and construction units of Sinopec Group, as the state-owned giant looked to expand its business overseas.

It is controlled by Sinopec Group and Sinopec Corp., which hold stakes of 2 percent and 98 percent, respectively.

Citic Securities, JPMorgan and UBS were hired as sponsors of the Sinopec Engineering offering.

China Galaxy International, Goldman Sachs and J.P. Morgan are acting as sponsors of the China Galaxy deal, with a group of 13 other banks also helping arrange it. The number of banks on the I.P.O. puts it near the record 17 hired by PICC for its listing last year.

Article source: http://www.nytimes.com/2013/05/06/business/global/06iht-sinopec06.html?partner=rss&emc=rss

G.M.’s Profit Falls 14% as It Speaks of Progress

G.M., the nation’s largest automaker, said global revenue dropped 2 percent during the quarter to $36.9 billion, despite a concerted effort to introduce new models in the United States and Europe.

The automaker’s core North American operations achieved a pretax profit of $1.4 billion, a 14 percent decline from the year-ago period.

But the company beat analysts’ earnings expectations and said it had narrowed losses in Europe during the quarter. G.M. shares rose 3 percent to close at $31.16 on Thursday.

G.M. has struggled to rebuild its business since the recession, when it needed a $49.5 billion government bailout and bankruptcy to survive. The automaker has since cut brands, models and thousands of jobs to bring costs more in line with production and sales.

The company’s chief executive, Daniel F. Akerson, said the decline in earnings and revenue did not reflect the progress G.M. was making with new models in the marketplace.

“The year is off to a strong start as we increased our global share with strong new products that are attracting customers around the world,” Mr. Akerson said in a statement.

G.M. lost market share in the United States last year to competitors like Chrysler and Toyota. Mr. Akerson has vowed to reverse that trend this year with vehicles like the new Cadillac ATS sedan and restyled versions of its big pickup trucks.

Comparisons between G.M. and Ford offer a stark contrast in how the two biggest Detroit automakers are managing their global business. Ford, the smaller of the two, has surpassed G.M. in growth and profitability at home, while the situation is reversed in Europe.

In the first quarter, Ford earned an average of $3,200 in pretax profit on each of the 761,000 vehicles it sold in North America, while G.M. earned about $1,700 on the 829,000 cars and trucks it sold in the region.

But in Europe, Ford’s loss widened in the first quarter to $462 million. G.M. reduced its European losses by 40 percent to $175 million.

The hottest competition between the companies is in the expanding pickup market in the United States.

Ford said on Thursday that it would add 2,000 jobs this year at its truck plant in Kansas City, Mo., and add a third shift of workers to build its industry-leading F-series pickup.

G.M. is transitioning to new versions of its Chevrolet Silverado and GMC Sierra pickups. But G.M. executives said on Thursday that there were no plans to increase truck production because a pickup plant in Texas was already operating at less than capacity.

Mr. Akerson said G.M. had improved its accounting and regional framework to focus on more profitable vehicles and markets. The company is building more plants in China and is making a big push to increase sales of its Cadillac luxury brand.

“We’re a very healthy company that’s getting stronger each quarter,” he said in a call with analysts Thursday.

In Asia, the company said pretax profits were about $495 million, slightly less than a year ago. South American operations had a pretax loss of $38 million, in contrast to a profit of $153 million last year.

Article source: http://www.nytimes.com/2013/05/03/business/gms-quarterly-profit-falls-14.html?partner=rss&emc=rss

U.S. Trade Deficit Narrowed in March

The deficit with China hit a three-year low.

The overall trade deficit decreased to $38.83 billion, an 11 percent drop from $43.6 billion in February, the Commerce Department reported Thursday.

Exports fell 0.9 percent, to $184.3 billion as sales of machinery, autos and farm products all declined.

Imports fell 2.8 percent, to $223.1 billion, led by a 4.4 percent drop in foreign petroleum. Crude oil imports averaged just seven million barrels a day, the lowest since March 1996.

A smaller trade gap can increase overall economic growth as American companies earn more from overseas sales while American consumers and businesses spend less on foreign products.

For the first three months of this year, the trade deficit is running at an annual rate of $507.7 billion, 5.9 percent below last year’s deficit of $539.5 billion. Economists are looking for the deficit to narrow slightly this year, in part because they expect continued gains in American exports.

Analysts said the lower-than-expected deficit in March will most likely give a slight boost to overall economic growth for the January-March quarter. The government’s first estimate put economic growth at 2.5 percent in the first quarter but some analysts said that could be revised up to perhaps 2.7 percent because of the lower trade deficit in March.

The politically vulnerable deficit with China shrank 23.6 percent in March, to $17.9 billion, still far above the imbalance with any other country.

Separately, the Labor Department reported Thursday that the productivity of American workers barely grew from January through March after shrinking in the final three months of 2012. Weak productivity growth could prompt employers to hire more if consumers and businesses continue to increase spending.

Worker productivity rose at a seasonally adjusted annual rate of 0.7 percent in the first quarter, after shrinking 1.7 percent in the previous quarter.

Labor costs increased at a seasonally adjusted annual rate of 0.5 percent, below the fourth quarter’s 4.4 percent gain.

Productivity is the amount of output per hour of work. It increased because output rose at a faster pace than hours worked.

The trend in productivity has been fairly weak in recent years. For all of 2012, productivity rose just 0.7 percent, after an even smaller 0.6 percent rise in 2011.

Article source: http://www.nytimes.com/2013/05/03/business/economy/us-trade-deficit-narrowed-in-march.html?partner=rss&emc=rss

Economix Blog: Can Every Group Be Worse Than Average? Yes.

FLOYD NORRIS

FLOYD NORRIS

Notions on high and low finance.

My Off the Charts column last week noted that pay disparities had grown in the United States since 2000. The real income necessary to reach the 90th percentile — the top 10 percent of all wage owners — was 9 percent higher in the first quarter than it had been 13 years earlier. The income necessary to be in the 10th percentile was down 3 percent over the same period. The pay needed to be at the median was up 1 percent.

The column showed similar trends among college graduates and among high school graduates.

What I did not point out, but might have, is an interesting statistical aberration. The pay necessary to reach the 90th percentile of every educational group rose less than the overall number. The same was true for the 10th percentile, the 25th percentile, the median and the 75th percentile.

How could that happen? Some readers deemed it evidence that I must have made a mistake.

The answer is that the relative size of the groups changed greatly over those 13 years. There are now many more college graduates working than there were then. There are fewer employees with a high school education or less. That changing nature of the work force meant that there are more (higher wage) well-educated people in the overall total now than there had been in 2000.

Adding to the population changes is the fact that the percentage of people with jobs has fallen less for college graduates (78.5 percent in 2000, 72.6 percent now) than it has for either high school graduates or people with some college education. The share of high school dropouts with jobs, however, is virtually the same now as it was in 2000.

As a result, we can get the following, seemingly unlikely, results:

Median change in real weekly wages, 2000-13

Total: +0.9%
High School Dropouts: -7.9%
High School Graduates, No College: -4.7%
Some College: -7.6%
Bachelor’s or Higher: -1.2%

Article source: http://economix.blogs.nytimes.com/2013/05/01/can-every-group-be-worse-than-average-yes/?partner=rss&emc=rss

Off the Charts: Wage Disparity Continues to Grow

The Labor Department last week reported the levels of “usual weekly wages” reported by Americans questioned in the household survey that determines the unemployment rate. The figures are released quarterly, with details on the distribution of wages available since 2000.

Those figures are different from total income, in that they ignore investment income as well as bonuses or overtime that is not considered usual. The national median wage in the first quarter of this year was $827 a week. In 2013 dollars, the median wage 13 years before was $819, so the increase is about 1 percent. The figures include all workers over the age of 25.

The department said that to reach the 90th percentile — that is, to earn more money than 90 percent of those with jobs — a person needed to earn $1,909 a week. That figure was nearly 9 percent higher than in early 1980.

To reach the 10th percentile — earning less money than 90 percent of those with jobs — required an income of $387 a week. After adjusting for inflation, that figure is down 3 percent from 2000.

The accompanying charts show the trends over time for the 25th and 75th percentiles, as well as the median and the 10th and 90th percentiles.

Put another way, in 2000 a worker in the 75th percentile made 48 percent more than a worker at the median, or 50th percentile. Now, a worker in that group earns 58 percent more.

The trends have been similar within education groups. The median income of college graduates in the first quarter of this year was $1,189 a week. Adjusted for inflation, that figure was about 1 percent less than the median 13 years earlier. To make the 90th percentile, a college graduate needed to earn $2,585 a week, a figure that is about 8 percent higher than the 2000 earnings needed.

There were somewhat similar trends among those with only high school diplomas, who are shown in the chart, and among those who attended college but did not earn a bachelor’s degree. Only among high school dropouts was the pattern different. Their real wages have fallen at every percentile.

The accompanying charts seem to indicate that real incomes went up for most groups during the financial crisis in 2009. That is, at least, a little misleading for several reasons. First, the number of people with full-time jobs declined. To the extent that those who lost jobs tended to be nearer the lower end of the wage distribution, that by itself would automatically raise the median income.

The second reason for that is that inflation virtually vanished during the crisis. The Consumer Price Index in the third quarter of 2010 was a little lower than it had been two years earlier. Because wages are “sticky,” they tend not to decline in nominal terms even if there is deflation. But when inflation returned, wage levels did not keep up.

It should also be noted that the people in the top 10 percent, or the bottom 10 percent, may change from one year to the next. It is possible that some people in the bottom 10 percent did better than the charts indicate, moving up to a higher percentile in later years. And, of course, some people presumably moved in the other direction as well.

Floyd Norris comments on finance and the economy at nytimes.com/economix.

Article source: http://www.nytimes.com/2013/04/27/business/economy/wage-disparity-continues-to-grow.html?partner=rss&emc=rss

Ford Profit Rises on Strong North American Sales

Ford, the nation’s second-largest automaker, said its revenue grew 10 percent in the quarter to $35.8 billion, compared with the year-ago period, and its market share continued to increase in the United States.

Despite unsettled economic conditions in international markets, the company reiterated forecasts that its full-year profits would at least match its performance in 2012.

“Our strong first-quarter results provide further proof that our One Ford plan continues to deliver,” said Alan R. Mulally, Ford’s chief executive.

Ford shares closed Tuesday at $13.36, up 2.3 percent and were up slightly in premarket trading. The results were better than analysts had expected, with Ford reporting a pretax profit of $2.1 billion, or 41 cents a share, exceeding forecasts of 37 cents a share, according to Thomson Reuters.

Ford said that strong sales in its core North American market propelled the company to its 15th consecutive profitable quarter. The company’s sales in the United States rose 11 percent in the first three months of this year, compared with a 6 percent increase for the overall industry.

In North America, Ford posted a pretax profit of $2.4 billion, a 14 percent improvement over the same period a year ago. The company said it was the best quarterly performance since it began reporting the region as a separate business unit in 2000.

The company has steadily rebuilt its product lineup in recent years, bringing out new versions of mainstay vehicles like the Explorer SUV and expanding production of smaller, more fuel-efficient cars like the Focus.

But Ford, like most other major automakers, continued to struggle overseas in the first quarter.

The company reported a pretax loss of $462 million in Europe – about triple the $149 million it lost in the region in the first quarter of 2012.

Ford has said it expects to lose up to $2 billion this year in Europe, where weak economic conditions have driven new vehicle sales to their lowest level in decades.

The company is closing a major assembly plant in Belgium, and accelerating other cost cuts in Europe. Ford said the “outlook for the business environment in Europe remains uncertain.”

In South America, Ford reported a pretax loss $218 million, after earning a profit of $54 million in the same period last year. The company said currency issues in Venezuela and Argentina depressed its results, but that it still expected to break even in the region for the entire year.

Results in Asia, where Ford is investing heavily in new factories and products, improved slightly. The company said it earned a pretax profit of $6 million in the region compared with a $95 million loss a year ago.

Article source: http://www.nytimes.com/2013/04/25/business/ford-profit-rises-on-strong-north-american-sales.html?partner=rss&emc=rss

Multinationals Rush to Invest in Indonesia

Today, that plant is humming. About 700 people work in the plant, 16 miles east of Jakarta, compared with about 30 just 18 months ago. And next month, G.M. will start delivering its first Indonesian-built vehicle in years, the Chevrolet Spin.

Auto sales are surging in Indonesia — up 17.8 percent in the first quarter from a year earlier — rewarding G.M. for the $150 million it recently invested in the country.

Other big multinational companies are racing to invest in factories and other operations to cash in on rising consumer demand in Indonesia, Southeast Asia’s biggest economy and most populous nation, with an estimated 251 million people.

While China and India have far larger economies, investment has slowed or declined. China said last week that foreign direct investment had risen an anemic 1.44 percent in the first quarter, to $29.9 billion. In India, the figure fell 6.3 percent to $3.95 billion in the first two months of the year, the most recent data available, according to India’s Department of Industrial Policy and Promotion.

Despite investors’ concerns about an unpredictable regulatory environment, a high level of corruption, inadequate infrastructure and rising labor costs, the money is gushing into Indonesia. The government reported Monday that foreign direct investment rose 27 percent in the first quarter to a record 65.5 trillion rupiah, or nearly $7 billion.

Indonesia has been on a roll since it emerged virtually untouched from the 2008 financial crisis. In 2009, it joined the Group of 20 large economies. It won its first investment-grade credit ratings in more than a decade in late 2011 and early 2012, and its gross domestic product has expanded at a steady rate of more than 6 percent for the last three years.

While overseas capital has long flowed into the resource-rich country’s mining, oil and natural gas sectors, many of today’s new foreign investors are focusing on the Indonesian consumer.

With its large population and a young labor force, Indonesia is in the midst of a consumer spending boom that analysts say could continue for years. Last month, the Boston Consulting Group projected that middle-class and affluent consumers in Indonesia would double to 141 million by 2020 — more than the entire population of Thailand.

While Asian conglomerates from Japan, Singapore and South Korea remain the top foreign investors, American and European companies are rushing in like never before. For example, in November the cosmetics giant L’Oréal opened its biggest factory in the world in West Java Province.

A decade ago, the last of Subway’s 10 franchised restaurants in Indonesia closed, but now the group is returning, said Stefan Grbovac, an area development manager for Subway in Singapore. He declined to provide details on local franchise partners or future store openings but he said the decision to come back to the country had been easy.

“Just look at this country — all of our competitors are here,” Mr. Grbovac said, including American franchises like Burger King, KFC and McDonald’s. “We’re definitely coming.”

As for G.M., it sold only 5,600 imported Chevrolets in Indonesia last year, accounting for 0.5 percent of the market. But G.M., the largest American carmaker, sees huge opportunities in reconstructing and expanding the 1.2 million-square-foot factory complex in Bekasi, that was shut in 2006.

The investment equals “a huge vote of confidence, not only in Indonesia but the structure of the country, the economic growth in the country,” Mr. Purty said. “We just don’t throw money around. We’ve had some pretty traumatic experiences in our life.”

Still, the challenges for foreign investors trying to do business in Indonesia are formidable. It can take 80 days to get a business license. In a global survey of the ease of doing business compiled by the World Bank, Indonesia ranked 128 out of 185 economies this year, a drop of 13 places from 2010. Transparency International ranked Indonesia 118 out of 176 countries in its most recent corruption perception index.

“Indonesia is punching below its weight as a big country,” said Andrew White, the managing director at the American Chamber of Commerce in Indonesia. “Indonesia is growing by 6 percent, but it should be growing by 10 percent.”

In an effort to reduce red tape, the Indonesian Investment Coordinating Board is cutting by half the number of documents foreign companies need to apply for a business license. It has installed online and real-time tracking of applications to further attract global brand names. One such company is Apple, which was granted a business license for manufacturing or retail even though it has yet to decide whether to invest in Indonesia, said M. Chatib Basri, whose job as board chairman is to attract foreign investment.

Mr. Basri said his pitch to foreign chief executives has been pretty straightforward, though hardly glowing: Asia in general, and Indonesia in particular, look far better than most regions right now.

“Indonesia is the least-unattractive country in the world,” Mr. Basri said. “Even though they have to deal with the problems of bureaucracy and infrastructure, the returns are higher than if you invest in Europe and the U.S. now.”

Article source: http://www.nytimes.com/2013/04/24/business/global/indonesia-sees-foreign-investment-surge.html?partner=rss&emc=rss

Manufacturing Growth in China Slows

HONG KONG — Growth in China’s important factory sector slowed in April, a closely watched monthly index released Tuesday showed, adding to concerns that the pace of China’s overall economic growth may be faltering.

The index, which is based on a survey of purchasing managers in the manufacturing sector and released by HSBC, came in at 50.5 points for April — still above the level of 50 that separates expansion from contraction, but markedly lower than the 51.6 points recorded for March.

The release is one of the earliest measures of business activity available for the month of April and appears to indicate that an unexpected growth slowdown during the first quarter may be carrying on into the second quarter.

China’s first-quarter growth data, released by the authorities in Beijing last week, surprised analysts who had believed that the economy had picked up speed during the months of January, February and March. Instead, expansion slowed to 7.7 percent from a year earlier – down from 7.9 percent the previous quarter.

The manufacturing survey released on Tuesday reinforced the view that growth is unlikely to pick up again during the current quarter.

‘’The overall message’’ from the release ‘’is that there was some improvement in the manufacturing sector’’ around the start of the fourth quarter of 2012, but that ‘’the momentum then stalled’’ in the first quarter of this year, wrote Yao Wei, China economist at Société Générale in Hong Kong.

Investors, unnerved by the disappointing reading, sent the mainland China stock market down 2.6 percent on Tuesday. In Hong Kong, the Hang Seng fell 1.1 percent.

In part, weakening demand for exports is to blame. Orders for new exports contracted in April after a temporary rebound in March, suggesting external demand for China’s exporters remains weak, according to Qu Hongbin, a China economist at HSBC.

Weaker overall demand has also started to weigh on employment in the manufacturing sector and is likely to prompt Beijing to respond with efforts to lift domestic investment and consumption in the coming months, Mr. Qu added in a statement accompanying the index.

Article source: http://www.nytimes.com/2013/04/24/business/global/manufacturing-growth-in-china-slows.html?partner=rss&emc=rss

DealBook: Blackstone Drops Out of the Bidding for Dell

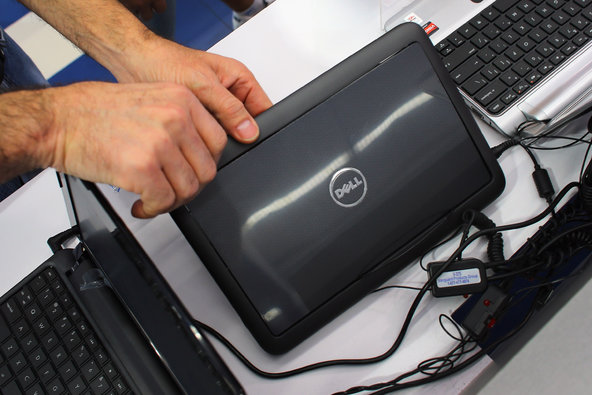
Dell’s founder, Michael S. Dell, and the investment firm Silver Lake are offering to take the company private in a $24.4 billion deal.Joe Raedle/Getty ImagesDell’s founder, Michael S. Dell, and the investment firm Silver Lake are offering to take the company private in a $24.4 billion deal.

10:25 a.m. | Updated

The Blackstone Group has walked away from the bidding for Dell, the computer maker confirmed on Friday.

The private equity giant, along with a separate bidder, the activist investor Carl C. Icahn, had been inspecting the books of the personal computer maker before deciding whether to make a rival bid to the $13.65-a-share offer to take the company private from the company’s founder, Michael S. Dell, and Silver Lake Partners, a technology-focused private equity firm.

Blackstone decided to withdraw after discovering that Dell’s business was deteriorating faster than it previously understood, according to a letter sent to the special committee of Dell’s board on Thursday. Among the reasons Blackstone cited include “an unprecedented 14 percent market decline in PC volume in the first quarter of 2013, its steepest drop in history, and inconsistent with management’s projections for modest industry growth.”

The personal computer industry has been grappling with falling prices and with competition from smartphones and tablets. Its weakness was vividly illustrated by a report last week by the International Data Corporation that showed a sharp drop in global sales.

PC unit sales overall in the United States fell 12.7 percent in the first quarter from a year earlier, according to the report. At Dell, United States shipments were down 14 percent, while worldwide shipments were down more than 10 percent.

Blackstone, which had been working with the investment firms Francisco Partners and Insight Venture Partners, last month outlined an offer of more than $14.25 a share for control of Dell, but not for the whole company. Part of Dell, under that scenario, would still be publicly traded in what is known as a stub.

From the beginning, there had been dissension within Blackstone about whether it should pursue an offer, people close to the firm said. Blackstone, worried that they would be used as a stalking horse, negotiated with Dell’s special committee to reimburse the firm for its costs related to pursuing a bid whether it ultimately made a binding bid or not.

The withdrawal of Blackstone leaves Mr. Icahn as the only potential rival to the $24.4 billion buyout proposal from Mr. Dell and Silver Lake.  Shares of Dell fell more than 3 percent in trading on Friday morning.

On Tuesday, the Dell special committee announced that it reached an agreement with Mr. Icahn that limits his ownership stake in the company while allowing him to contact other shareholders about a possible bid for the computer maker.

Mr. Icahn has previously outlined an offer of $15 a share for about 58 percent of the company. Under that plan, he would have a 24.1 percent stake in Dell.

“My affiliates and I expect to engage in meaningful discussions with other Dell shareholders, discussions that we believe will help to facilitate alternatives to the existing transaction with Michael Dell,” Mr. Icahn said in a statement on Tuesday.

Mr. Icahn and Blackstone were the only two preliminary bidders to emerge last month from the special committee’s process of soliciting potential alternatives, in what is known as a “go-shop.”

On Friday, a Dell spokesman said, “As the board’s special committee continues to oversee its process to ensure the best possible outcome for Dell shareholders, we remain focused on our customers and on providing innovative products and solutions to help them succeed.”

Blackstone’s letter to Dell’s special board committee is below:

Boulder Acquisition Corp.
c/o Blackstone Management Partners L.L.C.

April 18, 2013
STRICTLY PRIVATE AND CONFIDENTIAL

Special Committee of the Board of Directors of Dell Inc.
One Dell Way
Round Rock, Texas 78682
Attention: Alex Mandl, Presiding Director

Dear Alex,

I want to thank you, the Special Committee, and its advisors for inviting us into the process and for granting us due diligence access to Dell Inc. I also want to express our gratitude to Michael Dell and the management team for spending time with us and providing us with information and data relating to the business plan and financial forecasts of Dell.

You have asked for an update of our views after the intensive due diligence that we just completed. While we still believe that Dell is a leading global company with strong market positions, a number of significant adverse issues have surfaced since we submitted our letter proposal to you on March 22nd, including: (1) an unprecedented 14 percent market decline in PC volume in the first quarter of 2013, its steepest drop in history, and inconsistent with Management’s projections for modest industry growth; and (2) the rapidly eroding financial profile of Dell. Since our bid submission, we learned that the company revised its operating income projections for the current year to $3.0 billion from $3.7 billion.

For the reasons set forth above, among other reasons, on behalf of Boulder Acquisition Corp., Blackstone Management Partners, Francisco Partners, Insight Venture Partners, and Riverwood Capital, I regret to inform you that we will likely not pursue this opportunity. I would welcome the opportunity to speak to you to follow up on these matters and answer any questions that you may have.

Sincerely,

BOULDER ACQUISITION CORP.

By: /S/
Name: Chinh Chu

cc: Roger Altman, Evercore Partners

A version of this article appeared in print on 04/19/2013, on page B2 of the NewYork edition with the headline: Blackstone Is Said to Drop Out of the Bidding for Dell.

Article source: http://dealbook.nytimes.com/2013/04/18/blackstone-seen-abandoning-bid-for-dell/?partner=rss&emc=rss