Jared Bernstein is a senior fellow at the Center on Budget and Policy Priorities in Washington and a former chief economist to Vice President Joseph R. Biden Jr.
While some important parts of the current economy are showing strength — housing, energy extraction, corporate profitability — demand for labor, or “job creation” if you prefer, remains weak. That’s a huge problem because most of us depend on our paychecks, not our stock portfolios, so the fact that there’s still about 12 million unemployed (including four million who’ve been jobless for over half a year) in addition to about eight million involuntary part-timers (who want more hours, and can’t find them) should give one pause before declaring all clear on the economic front.
Today’s Economist
Perspectives from expert contributors.
Weak labor demand plays an integral role in these outcomes, but too much of the rhetoric I’ve been hearing lately ignores that reality. In the immigration debate — and I’m a longtime active supporter of comprehensive reform — advocates in both parties argue that there are lots of job slots waiting to be filled, if only we had greater labor supply. This claim is most commonly made regarding high-skilled workers, like programmers, but one advocate recently wrote a commentary arguing that we also face a shortage of low-wage workers. Anyone with even cursory knowledge of employment or especially wage trends among such workers knows that this is not a credible claim.
It’s even worse over in the poverty debate, where contentions about the safety net, a topic I wrote about last week, suggest that the jobs are there for the taking if only SNAP (food stamps) and other benefits weren’t removing the incentives for low-income people to look for work. (The Southerland amendment to the farm bill, a key reason the bill failed in the House, was very much written in this spirit.)
The extent to which such claims are misguided came back to me as I was working with some new data on the importance of strong labor demand, particularly to low- and middle-income workers. The data are simply the annual hours of work by income group over the last few decades, with households split into fifths by income, from the poorest to the wealthiest 20 percent, or quintile (e.g., “Q1” in the figure below represents the lowest-income quintile).
The trends reveal the disproportionate impact of strong labor demand on low relative to high income workers. Basically, using the economic model introduced in “Field of Dreams,” it’s an “if the jobs are there, they will come” story, which is decidedly different than “if they come, the jobs will be there” (economists will recognize the latter as Say’s Law).
A simple statistical model of the relationship between annual hours and unemployment shows that since the mid-1970s, for every point the unemployment rate falls, annual hours of work go up by 3.7 percent for low-income workers from the bottom fifth of the income scale, 1.7 percent (about half as much) for middle-income workers, and 0.8 percent (half as much again) for high-income workers.
But these are broad historical averages. During the late 1990s, the last time the United States economy was at full employment, low-income workers were remarkably responsive to strong labor demand. Between 1996 and 2000, for each point the unemployment rate fell, their hours of work rose more than 10 percent.
The figure below provides some historical context. The first three bars for each income group shows the percentage change in annual hours worked over the last four years of the last three recoveries — if the recovery is going to reach full employment, that’s when it will do so. The fourth bar in each set shows the most recent years of data, tracking the hours impact of the Great Recession.
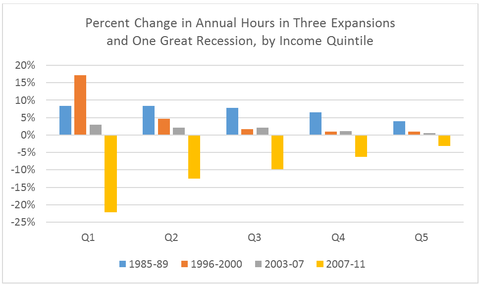 Q1 represents lowest fifth of income distribution, Q5 the highest. Source: Author’s analysis of Census Bureau data (Annual Social and Economic Supplement), provided by Arloc Sherman of Center on Budget and Policy Priorities.
The first thing to notice is how much more responsive the trends are for lower relative to higher-income households: they go up more in good times and fall further in bad ones. That doesn’t imply the rich are lazier. To the contrary, it’s because they’re already maxed out on hours worked and their jobs tend to be much more insulated from changing demand conditions.
The second thing to notice is how much the 1990s recovery stands out. There was a lot going on in those years — more on that in a moment — but the main factor was full employment: the demand for low-wage work in particular was stronger than it has been for years before or since. Their average annual hours rose 17 percent, 1996-2000, amounting to almost three more weeks of full-time work.
Third, the 2000s were a uniquely weak period of labor demand. Employment growth in those years was the worst on record, with data going back to the 1940s. One is tempted to tell a failed supply-side economics story, but the Reagan years, which look good by this measurement, especially for middle-income families, complicate that explanation (the George W. Bush economics regime hewed much closer to trickle-down theory than did the Reagan team — taxes were actually raised numerous times in the Reagan years).
Finally, the benefits of full employment to the least advantaged are perhaps most clearly shown by the counterexample of the great crash, which slammed low- and middle-income families relative to the wealthy.
What other factors besides full employment, then, were in play in the 1990s? For one, welfare reform pushed a lot of single mothers into work, a factor much more conducive to the “if they come, the jobs will be there” view that I dismissed above. But careful research finds that welfare reform explains less than 15 percent of the increase in work among low-income single mothers, who themselves represent less than 20 percent of the bottom fifth in the figure shown above. That’s not nothing, but it’s a relatively small part of the story. Moreover, work-based welfare reform was there in the 2000s too, and that period doesn’t look so good.
Opponents of immigration reform should also note that while the 1990s was a period of strong immigrant flows of low-skilled workers, increased labor demand handily absorbed those flows.
I suspect that most objective observers will agree that full employment — strong labor demand, substantial job creation — is a (I’d say “the”) key economic, social, and poverty policy that’s missing from the current agenda.
So how do we get there? Stay tuned…
(The findings discussed above are from a coming book on the importance of full employment, written with Dean Baker.)
Article source: http://economix.blogs.nytimes.com/2013/07/01/full-employment-the-big-missing-piece/?partner=rss&emc=rss