April 25, 2024

Today’s Economist: Casey B. Mulligan: Health Reform, the Reward to Work and Massachusetts

DESCRIPTION

Casey B. Mulligan is an economics professor at the University of Chicago. He is the author of “The Redistribution Recession: How Labor Market Distortions Contracted the Economy.”

The United States labor market is in for a shock when health reform is fully carried out, regardless of what employers decide about health insurance or how smoothly reform might have unfolded in Massachusetts.

Today’s Economist

Perspectives from expert contributors.

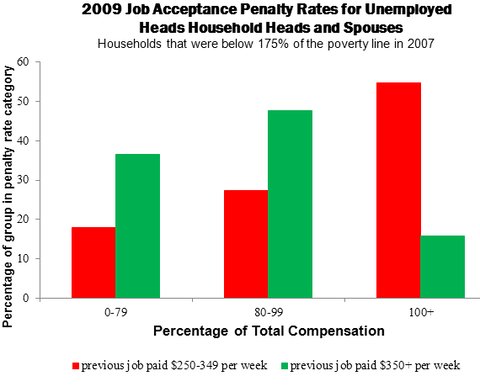
Beginning next year, millions of Americans will be eligible for generous subsidies in the form of cash assistance to pay for their health insurance premiums and out-of-pocket health expenses pursuant to the Affordable Care Act. The subsidies will sharply reduce the financial reward to working because they will be phased out with household income.

As the Princeton economists Alan B. Krueger, who has held positions in the Obama administration, and Uwe E. Reinhardt, my Economix colleague, explain, health insurance premium assistance “would present millions of low-income American families with total marginal tax rates in excess of 75 percent.” They add, “Such high marginal tax rates may well make unemployment and welfare an attractive alternative to working.”

It would appear that, together with per-employee penalties levied on employers, the new law’s health insurance subsidies could significantly affect the labor market.

Most workers are offered affordable health insurance by their employers, and the new law will consider them ineligible for subsidies and will not ask their employers to pay any penalty. You might guess that the aggregate labor-market impact of the law could be small, because the penalties and subsidies would not apply to the majority of the work force “covered” by employer health insurance.

But it is wrong to assume that the law will have little effect on the reward to working among covered workers. Their employers could drop coverage, or the employee could switch to a job without coverage. More important, the subsidies are available to the unemployed and others who do not work, even if their previous jobs had provided coverage. If and when they go back to work in a covered job, federal law will welcome their return by taking their subsidy away.

Yet another reason that covered workers will experience high marginal tax rates like those noted by Professors Krueger and Reinhardt is that the subsidies will be available to family members on the basis of the employee’s income, in combination with his or her spouse’s income, if any.

The Department of Health and Human Services says there is no reason for alarm because the experience in Massachusetts since 2006 shows “that the health care law will improve the affordability and accessibility of health care without significantly affecting the labor market,” as I noted last week, referring to a Washington Examiner report.

For those worried about dire labor market consequences of the federal law, Jonathan Gruber of the Massachusetts Institute of Technology replies (at 27:32 in this video): “We’ve actually run this experiment, folks, we ran it in Massachusetts. O.K. In Massachusetts, we put in a system with more generous subsidies than the federal government is doing.”

When it comes to quantifying the new federal law’s penalty on employment, Professor Gruber and Health and Human Services are incorrect to take comfort in the Massachusetts experience since 2006. As I explained last week, the federal law’s employer penalty is more than tenfold the Massachusetts penalty. In other words, if the Massachusetts penalties pushed down workers’ wages by 16 cents an hour, the federal penalties would push them down $1.67.

Professor Gruber is also incorrect that the federal law is introducing less generous subsidies than the Massachusetts law did. Federal subsidies will be available for people laid off from their jobs, but the new Commonwealth Care subsidies in Massachusetts are not, because Commonwealth Care excludes people eligible for the Medical Security Program (a longstanding program providing health benefits to Massachusetts people receiving cash unemployment benefits).

Moreover, people leaving a job with health insurance have to wait six months before they can enter Commonwealth Care.

Commonwealth Care also excludes children: if a Massachusetts resident wants health insurance subsidies for his or her children, Medicaid is the primary option. The federal law has no such restriction: it allows Americans to receive subsidies while enrolling their entire families in the same health plan as, say, the United States senators representing their states.

Indeed, many consumers may perceive Commonwealth Care to be an extension of Medicaid. When it began, Commonwealth Care consisted of four plans offered by the state’s Medicaid Managed Care Organizations (a fifth plan has recently been added). Perhaps that’s why only 158,000 people were enrolled in Commonwealth Care as of 2011, which is less than 10 percent of the people in Massachusetts whose family income fell in the interval required by the program.

In contrast, recipients of federal subsidies will be receiving cash they can spend on a plan of their choice: that’s a lot more generous than helping people join Medicaid.

For all these reasons, economic reasoning points to a contraction of the United States labor market as the full Affordable Care Act is carried out, regardless of what may have happened in Massachusetts.

Article source: http://economix.blogs.nytimes.com/2013/03/06/health-reform-the-reward-to-work-and-massachusetts/?partner=rss&emc=rss

Economix Blog: Casey B. Mulligan: A Tale of Two Welfare States

DESCRIPTION

Casey B. Mulligan is an economics professor at the University of Chicago. He is the author of “The Redistribution Recession: How Labor Market Distortions Contracted the Economy.”

In “A Tale of Two Cities,” Dickens wrote, “It was the age of wisdom, it was the age of foolishness.” The governments of the United States and Britain are embarking on different approaches to helping their poor and unemployed, and one of them may regret its policy decisions.

Today’s Economist

Perspectives from expert contributors.

As recently as 2010, Britain had a complex system of antipoverty programs ranging, including housing benefits, job seekers’ allowances and mortgage-interest assistance. With so many benefits available, many people found they could make almost as much from the combined programs as they could from working, even while any one of the benefits might not have been all that significant by itself. As Britain’s Department for Work and Pensions described, beneficiaries remained “trapped on benefits for many years as a result.”

Beginning next month, Britain will strive to put its welfare system on a different path by unifying many programs under a single “universal credit” system, what the department describes as an “integrated working-age credit that will provide a basic allowance with additional elements for children, disability, housing and caring.” The department forecasts that its “universal credit will improve financial work incentives by ensuring that support is reduced at a consistent and managed rate as people return to work and increase their working hours and earnings.”

In the United States, the welfare system includes dozens of federal programs, enumerated by Robert Rector of the Heritage Foundation as those “providing cash, food, housing, medical care, social services, training and targeted education aid to poor and low-income Americans.” Beginning in 2014, more programs will be added and expanded by the Patient Protection and Affordable Care Act: new health-insurance premium-support programs, new cost-sharing subsidies for out-of-pocket health expenditures, financial hardship relief from the new individual mandate penalties, new subsidies for small businesses employing low-income people and expansion of Medicaid.

The Congressional Budget Office estimates that the Affordable Care Act’s means-tested subsidies and cost-sharing will implicitly add more than 20 percentage points to marginal tax rates on incomes below 400 percent (see Page 27 of the C.B.O. report) of the poverty line (a majority of families fit in this category) by phasing out the assistance as family incomes increase, although a number of families will not receive the subsidies because they already get health insurance from their employer.

These marginal tax-rate additions are on top of the marginal tax rates already in place because of personal income taxes, payroll taxes, unemployment insurance, food stamps and other taxes and means-tested government programs. In 2014, some Americans will be able to make almost as much from combined benefits as they would by working, and sometimes more.

In summary, the United States intends to move in the direction of more assistance programs and higher marginal tax rates, while Britain intends to move in the direction of fewer programs and lower marginal tax rates.

Either country, or both, may ultimately fail to fully carry out the new programs by granting waivers and exceptions, refusing to administer them or by rewriting its new laws. But if both do follow through, perhaps future empirical economic research comparing the United States and Britain will reveal which country is living an age of wisdom and which one in an age of foolishness.

Article source: http://economix.blogs.nytimes.com/2012/12/19/a-tale-of-two-welfare-states/?partner=rss&emc=rss

Economix Blog: Casey B. Mulligan: The Microeconomics of Poverty Since 2007

DESCRIPTION

Casey B. Mulligan is an economics professor at the University of Chicago. He is the author of “The Redistribution Recession: How Labor Market Distortions Contracted the Economy.”

Government safety net programs were put on steroids by the 2009 stimulus law, erasing incentives for a significant fraction of the unemployed.

Today’s Economist

Perspectives from expert contributors.

Last week I noted that poverty, when measured to include taxes and government benefits, did not rise from 2007 to 2011. That result, I contended, indicated that people in the neighborhood of the poverty line faced marginal tax rates of about 100 percent. I also noted that 100 percent marginal tax rates were excessive.

These three statements generated many angry comments, so it’s worth examining them in more detail.

One possibility is that the poverty rate did rise significantly, even when adjusted to reflect taxes and government benefits. That possibility would contradict Jared Bernstein’s work in this area, because he concluded that America had “the deepest recession since the Great Depression and poverty didn’t go up.” It would also contradict Arloc Sherman’s findings that the poverty rate was essentially unchanged (thanks to generous new subsidies).

The measurement of poverty and its trends is an important and continuing research area, and future research could suggest that the poverty rate had increased. However, future research could also point in the other direction.

In 1995, a panel established by the National Research Council to evaluate poverty measurement concluded that it might make sense to recognize not only the monetary resources available to families, but also the amount of free time they had. After 2007, many people found themselves with less pretax income and more free time because they had lost their jobs. Because the official poverty measures consider only the pretax income, adjusting poverty measures to reflect free time would cause the poverty rate to fall more, or increase less, after 2007.

Assuming for the moment that Mr. Bernstein and Mr. Sherman are right about the poverty changes, a second possibility is that poverty failed to rise even while marginal tax rates were significantly less than 100 percent. As one blogger put it, “Just because poverty rates didn’t rise doesn’t mean that the government imposed a 100 percent implicit tax rate.”

One might wonder exactly how, in theory, poverty rates remained fixed when millions of people lost their jobs, and when the government did not essentially replace all the disposable income lost because of layoffs. The magnitude of marginal tax rates imposed by the government is ultimately an empirical question, though. As far as I know, none of my detractors have offered any estimates.

I have been examining marginal tax rates under the American Recovery and Reinvestment Act of 2009, especially as experienced by families near the poverty line. The chart below shows some of my results pertinent to Mr. Bernstein’s poverty measures.

The chart examines households that in 2007 had household income of less than 175 percent of the poverty line and were therefore at risk of falling into poverty if they were later laid off from their job. The chart organizes unemployed heads and spouses in terms of their marginal tax or “job acceptance penalty” rate. With that rate, I mean the fraction of a person’s employee compensation that goes to federal, state and local government treasuries or to expenses associated with commuting to work (I assume that is $5 for each one-way trip) as a consequence of working full time at the same wage as before layoff rather than remaining unemployed. (The remainder of the worker’s compensation, if any, is left to enhance the disposable income of the worker and the worker’s family.)

The chart also organizes unemployed people in terms of what they earned weekly before layoff, with special attention to the group in the $250 to $349 range, which is near the weekly earnings of a full-time minimum-wage job.

Among the unemployed who had earned near minimum wage (shown in red in the chart), a majority had a job-acceptance penalty rate of at least 100 percent, meaning that accepting a job with the same pretax pay as they had before layoff would not increase their disposable income. If they were to accept such a job, all the compensation would go to the Treasury in additional personal income taxes, additional payroll taxes and reduced unemployment insurance benefits (under the stimulus, unemployment insurance benefits alone were more than half of the pretax pay from the previous job), and in some cases reduced benefits from the Supplemental Nutrition Assistance Program, known as SNAP, and Medicaid.

Only 18 percent of those earning near minimum wage had a job-acceptance penalty rate of less than 80 percent.

My results consider the unemployment insurance program and its federal additional compensation and subsidies for Cobra, which gives workers who have lost their jobs the right to purchase group health insurance for a limited period of time; SNAP; Medicaid; the regular personal income tax (both federal and state); the earned-income tax credit, the child tax credit, the additional child tax credit and the “making work pay” tax credit.

Job-acceptance penalty rates of 100 percent or more are probably more prevalent than shown in the chart because I did not include child care costs among employment expenses and did not include programs like disability insurance, Temporary Assistance for Needy Families and Supplemental Security Income, means-tested housing subsidies, means-tested tuition assistance, means-tested energy-assistance programs and other programs that impose positive implicit marginal tax rates.

I agree with Mr. Bernstein that government policy, especially the 2009 stimulus law, is responsible for preventing a rise in the poverty rate. But it achieved that end by erasing incentives for a significant fraction of the unemployed.

Article source: http://economix.blogs.nytimes.com/2012/12/12/the-microeconomics-of-poverty-since-2007/?partner=rss&emc=rss

Today’s Economist: Casey B. Mulligan: Is the Fiscal Cliff a Big Deal?

DESCRIPTION

Casey B. Mulligan is an economics professor at the University of Chicago.

With their Keynesian analysis, the Congressional Budget Office and others have exaggerated the effects of the “fiscal cliff” on the labor market and the economy.

Today’s Economist

Perspectives from expert contributors.

Come January, current law provides for significant cuts in federal spending and for tax increases – and thereby significant federal budget-deficit reduction. These provisions have been collectively described as the “fiscal cliff,” which emerged when Democratic and Republican leaders could not agree on plans on spending and taxes.

The Congressional Budget Office has warned that the fiscal cliff will cause a double-dip recession, but its analysis for 2013 is based on the Keynesian proposition that anything that shrinks the federal budget deficit shrinks the economy, and the more the deficit is reduced the more the economy is reduced.

In many circumstances, the Keynesian proposition reaches the wrong conclusions about economic activity, because deficits do not necessarily expand the economy or prevent it from shrinking. For example, reducing the deficit by cutting unemployment insurance – it’s one of the programs that would be cut in January – would shrink the economy in the C.B.O.’s view.

But in reality, cutting unemployment insurance would increase employment, as it would end payments for people who fail to find work and would reduce the cushion provided after layoffs.

Helping people who are out of work may be intrinsically valuable because it’s the right thing to do, but the Congressional Budget Office is incorrect to conclude that it also grows the economy or prevents it from shrinking. Paying people for not working is no way to put them to work.

The Keynesian proposition about budget deficits ignores incentives of all kinds, so its incorrect conclusions about the fiscal cliff are not limited to unemployment insurance. Another example: the fiscal cliff would put millions of Americans on the alternative minimum tax, which Keynesian analysis said would shrink the economy solely because it collected more revenue.

Yet economists who have studied the alternative minimum tax have found that its effects on incentives to work and produce are essentially neutral, compared with the ordinary federal personal income tax.

(The Congressional Budget Office does not use pure Keynesian analysis for its long-term projections, which include labor-supply incentive effects of tax rates, but apparently has decided that incentives’ effects can be safely neglected in the short term.)

None of this implies that the fiscal cliff will expand the economy, because some of its provisions will increase the penalties for working and producing.

The fiscal cliff would cut Medicare payments to doctors by 2 percent, which reduces doctors’ reward for treating Medicare patients. This may cause doctors to work less (or to work more for non-Medicare patients). The fiscal cliff would end the “Bush tax cuts” provisions, some of which have been enhancing the incentive to work (but beware – not all laws labeled “tax cuts” enhance incentives).

Perhaps the incentive-reducing provisions of the fiscal cliff outweigh its incentive-enhancing provisions, in which case the Congressional Budget Office has arrived at approximately the right answer for the wrong reasons.

But even in that lucky case, the C.B.O.’s quantitative estimates of the fiscal cliff’s economic effects are not reliable until they fully incorporate economic incentives.

Article source: http://economix.blogs.nytimes.com/2012/08/29/is-the-fiscal-cliff-a-big-deal/?partner=rss&emc=rss

Economix Blog: Casey B. Mulligan: With Unemployment Insurance, Is 99 Weeks the Magic Number?

DESCRIPTION

Casey B. Mulligan is an economics professor at the University of Chicago.

A possible compromise between Democrats who want to leave the unemployment compensation system unchanged and Republicans who want to return to pre-recession benefit formulas might be to adopt a benefit formula from some of the previous recessions.

Today’s Economist

Perspectives from expert contributors.

At the end of 2011, Congress allowed unemployment beneficiaries to continue to collect under both the emergency and extended programs, which permit the unemployed to receive benefits for up to 99 weeks of unemployment.

Some economists believe that unemployment insurance stimulates spending because unemployed people are thought to spend most, if not all, of the money they have on hand. Some economists also suggest that unemployment insurance prolongs unemployment because an unemployed person has to give up his benefits as soon as he finds and starts a new job or returns to working at his previous job. Either way, some people cannot find work, and unemployment benefits help cushion their blow.

The ideal amount of time to permit the unemployed to collect benefits is a trade-off between the insurance the program provides and the unintended work disincentives it creates. For now, our government has decided that 99 weeks is the ideal time (92 in many states, and a bit less in others).

The maximum duration of benefits was much less in previous recessions. I examined the 12 episodes since 1960 when Congress increased the amount of time the unemployed could receive benefits, together with the most recent month with unemployment data (November 2011).

U.S. Department of Labor

The vertical axis in the scatter diagram measures the maximum amount of time that the unemployed could receive benefits for each of the 12 law changes. The most recent law change was December 2009, when regular state and federal emergency and extended benefits could last up to 92 weeks (for comparability across recessions, here I ignore the few states that add seven additional weeks of extended benefits, bringing the total to 99).

We reached 92 weeks in a couple of steps. In July 2008, benefits began to last 52 weeks. Later that year, the maximum benefit duration was lengthened to 72 weeks.

In the 50 years before December 2008, the maximum benefit period was 72 weeks during the 1992 recession. Benefits lasted up to 65 weeks in the 2001-2 and 1975 recessions.

The horizontal axis graphs the unemployment rate at the time that unemployment insurance legislation was changed. Since 1960, only in the 1982 recession did the unemployment rate get so high. Nevertheless, unemployment benefits in that recession lasted at most 55 weeks – about three-fifths of the time that unemployment benefits last today.

Since the December 2009 law change, the unemployment rate has fallen, although nowhere near back to normal. With the recession officially ended almost three years ago, today’s unemployment rate is still similar to that in 1975 – one of the more severe recessions of the past. Still, when the unemployment rate was almost 9 percent in spring 1975, Congress decided to limit unemployment benefits to 65 weeks.

These comparisons may suggest that continuing or terminating emergency and extended unemployment benefits are not the only policy choices. The programs could be continued but perhaps with a lesser duration, such as 52 or 65 weeks as in previous severe recessions.

Article source: http://feeds.nytimes.com/click.phdo?i=8108571acc35a3a43236d39367bca844