November 22, 2024

Economix Blog: Starving the Beast

In the 1950s, government spending fell quickly after the Korean War ended. In the second quarter of 1956, the total government gross domestic product was $91.4 billion, at an annual rate. That was 0.4 percent lower than the $91.8 billion rate three years earlier, in the third quarter of 1953.

FLOYD NORRIS

FLOYD NORRIS

Notions on high and low finance.

It would be almost 60 years before another such decline was recorded.

The G.D.P. report released Friday states the total government part of G.D.P. – federal, state and local – came to $3.0306 trillion in the first quarter of this year. That is 0.01 percent below the $3.0309 trillion recorded four years earlier.

Those are nominal figures, not adjusted for inflation (as are the figures in the chart below). On a real basis, the decline was 6.5 percent.
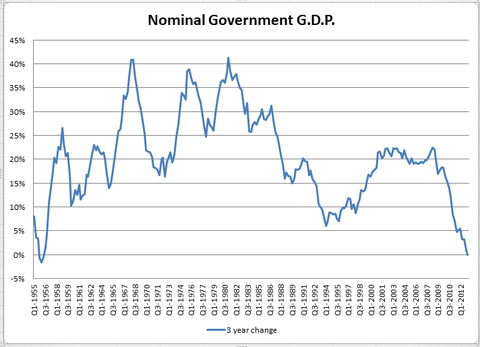
Source: Bureau of Economic Analysis, via Haver Analytics

Those who complain about big government will point out, correctly, that some government spending does not show up that way in the G.D.P. accounts. Transfer payments like Social Security are recorded when the recipient spends the money, and characterized based on what he or she bought. But the figure does include all the salaries paid by governments, and all the things they buy, from schoolbooks to rifles.

Governments as a group had 648,000 fewer employees in March than they had three years earlier. Some of that decline – 87,000 jobs – reflects temporary employment for the 2010 census, but the rest reflects real cutbacks. Most of that decline has been in local government jobs, and most of the fall in local government jobs has come in schools.
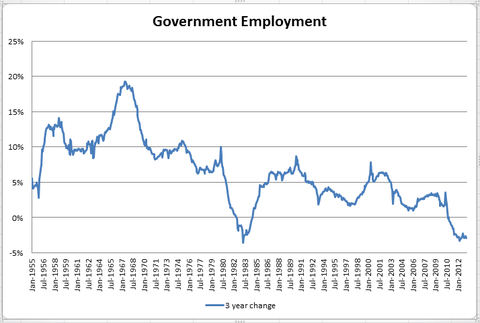
Source: Bureau of Labor Statistics, via Haver Analytics

In the G.D.P. numbers, state and local spending is up a little over the last three years, measured in nominal terms. The decline came from federal spending.

Aides to Ronald Reagan used to talk about “starving the beast.” In the Obama years, it is happening.

Article source: http://economix.blogs.nytimes.com/2013/04/26/starving-the-beast-2/?partner=rss&emc=rss

Union Membership Rate Fell Again in 2011

The nation’s union membership rate continued a decades-long slide last year, falling to 11.8 percent of the American work force in 2011, the Bureau of Labor Statistics announced in a report on Friday.

That was down from 11.9 percent the previous year even though total union membership edged up, rising by 49,000 last year to 14.76 million. The overall membership rate declined because the increases in organized labor’s ranks did not keep pace with overall growth in employment.

The bureau announced these numbers as the nation’s labor unions have been coming under heavy political attack. Republican governors and Republican-controlled legislatures in Wisconsin and in several other states have pushed to curb the power of public employees to bargain collectively. Moreover, Indiana is poised to become the first state in more than a decade to enact a “right to work” law, which bans employers and unions from agreeing to contracts that require workers to pay fees for union representation.

According to the bureau, 16.3 million workers are represented by unions, some 1.5 million more than the total membership, indicating that many workers opt out of joining the unions that represent them at their workplaces.

The percentage of public sector workers in unions was 37 percent last year, more than five times the 6.9 percent membership rate for private sector workers. In the 1950s, more than 35 percent of private sector workers were in unions.

The Bureau of Labor Statistics said the number of private sector workers in unions increased by 110,000 to 7.2 million, buoyed by a rebound in manufacturing and construction employment. But with many states, cities and school districts laying off employees, the number of public sector workers in unions dropped 61,000, to 7.56 million.

The bureau found that New York State had the highest unionization rate, 24.1 percent, followed by Alaska (22.1 percent) and Hawaii (21.5 percent). North Carolina had the lowest rate, 2.9 percent, with South Carolina second-lowest (3.4 percent). The data was collected in the Current Population Survey, a monthly survey of 60,000 households.

Article source: http://feeds.nytimes.com/click.phdo?i=87b5f6a047996f724462ab20888136af