Casey B. Mulligan is an economics professor at the University of Chicago. He is the author of “The Redistribution Recession: How Labor Market Distortions Contracted the Economy.”
Government safety net programs were put on steroids by the 2009 stimulus law, erasing incentives for a significant fraction of the unemployed.
Today’s Economist
Perspectives from expert contributors.
Last week I noted that poverty, when measured to include taxes and government benefits, did not rise from 2007 to 2011. That result, I contended, indicated that people in the neighborhood of the poverty line faced marginal tax rates of about 100 percent. I also noted that 100 percent marginal tax rates were excessive.
These three statements generated many angry comments, so it’s worth examining them in more detail.
One possibility is that the poverty rate did rise significantly, even when adjusted to reflect taxes and government benefits. That possibility would contradict Jared Bernstein’s work in this area, because he concluded that America had “the deepest recession since the Great Depression and poverty didn’t go up.” It would also contradict Arloc Sherman’s findings that the poverty rate was essentially unchanged (thanks to generous new subsidies).
The measurement of poverty and its trends is an important and continuing research area, and future research could suggest that the poverty rate had increased. However, future research could also point in the other direction.
In 1995, a panel established by the National Research Council to evaluate poverty measurement concluded that it might make sense to recognize not only the monetary resources available to families, but also the amount of free time they had. After 2007, many people found themselves with less pretax income and more free time because they had lost their jobs. Because the official poverty measures consider only the pretax income, adjusting poverty measures to reflect free time would cause the poverty rate to fall more, or increase less, after 2007.
Assuming for the moment that Mr. Bernstein and Mr. Sherman are right about the poverty changes, a second possibility is that poverty failed to rise even while marginal tax rates were significantly less than 100 percent. As one blogger put it, “Just because poverty rates didn’t rise doesn’t mean that the government imposed a 100 percent implicit tax rate.”
One might wonder exactly how, in theory, poverty rates remained fixed when millions of people lost their jobs, and when the government did not essentially replace all the disposable income lost because of layoffs. The magnitude of marginal tax rates imposed by the government is ultimately an empirical question, though. As far as I know, none of my detractors have offered any estimates.
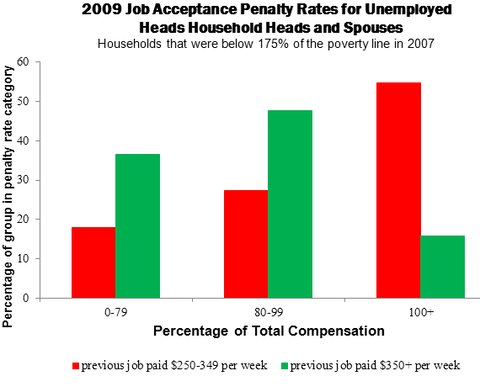
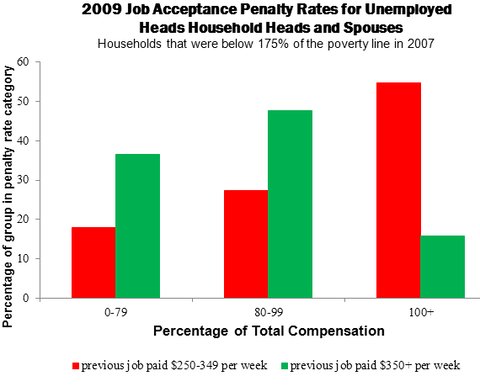
I have been examining marginal tax rates under the American Recovery and Reinvestment Act of 2009, especially as experienced by families near the poverty line. The chart below shows some of my results pertinent to Mr. Bernstein’s poverty measures.

The chart examines households that in 2007 had household income of less than 175 percent of the poverty line and were therefore at risk of falling into poverty if they were later laid off from their job. The chart organizes unemployed heads and spouses in terms of their marginal tax or “job acceptance penalty” rate. With that rate, I mean the fraction of a person’s employee compensation that goes to federal, state and local government treasuries or to expenses associated with commuting to work (I assume that is $5 for each one-way trip) as a consequence of working full time at the same wage as before layoff rather than remaining unemployed. (The remainder of the worker’s compensation, if any, is left to enhance the disposable income of the worker and the worker’s family.)
The chart also organizes unemployed people in terms of what they earned weekly before layoff, with special attention to the group in the $250 to $349 range, which is near the weekly earnings of a full-time minimum-wage job.
Among the unemployed who had earned near minimum wage (shown in red in the chart), a majority had a job-acceptance penalty rate of at least 100 percent, meaning that accepting a job with the same pretax pay as they had before layoff would not increase their disposable income. If they were to accept such a job, all the compensation would go to the Treasury in additional personal income taxes, additional payroll taxes and reduced unemployment insurance benefits (under the stimulus, unemployment insurance benefits alone were more than half of the pretax pay from the previous job), and in some cases reduced benefits from the Supplemental Nutrition Assistance Program, known as SNAP, and Medicaid.
Only 18 percent of those earning near minimum wage had a job-acceptance penalty rate of less than 80 percent.
My results consider the unemployment insurance program and its federal additional compensation and subsidies for Cobra, which gives workers who have lost their jobs the right to purchase group health insurance for a limited period of time; SNAP; Medicaid; the regular personal income tax (both federal and state); the earned-income tax credit, the child tax credit, the additional child tax credit and the “making work pay” tax credit.
Job-acceptance penalty rates of 100 percent or more are probably more prevalent than shown in the chart because I did not include child care costs among employment expenses and did not include programs like disability insurance, Temporary Assistance for Needy Families and Supplemental Security Income, means-tested housing subsidies, means-tested tuition assistance, means-tested energy-assistance programs and other programs that impose positive implicit marginal tax rates.
I agree with Mr. Bernstein that government policy, especially the 2009 stimulus law, is responsible for preventing a rise in the poverty rate. But it achieved that end by erasing incentives for a significant fraction of the unemployed.
Article source: http://economix.blogs.nytimes.com/2012/12/12/the-microeconomics-of-poverty-since-2007/?partner=rss&emc=rss

