April 20, 2024

Today’s Economist: Casey B. Mulligan: Patterns of Health Insurance Changes

DESCRIPTION

Casey B. Mulligan is an economics professor at the University of Chicago. He is the author of “The Redistribution Recession: How Labor Market Distortions Contracted the Economy.”

A number of industries can expect big changes in employee health insurance in the next year or two, while others will continue with business as usual.

Today’s Economist

Perspectives from expert contributors.

Beginning next year, states and the federal government intend to create opportunities for families to purchase health insurance, separate from their employers, through insurance “exchanges” in the states. Insurers and the federal government will heavily advertise the new plans. Most important, middle- and low-income families may qualify for valuable federal subsidies that will serve to reduce premiums and out-of-pocket health costs.

To qualify for subsidized exchange plans, workers cannot be offered affordable insurance by their employers. Paradoxically, employers will create subsidy opportunities for their middle- and low-income employees whenever they fail to offer health insurance.

On the other hand, an employer dropping its health insurance next year will put its high-income employees in a tough spot, because they will have to buy insurance on their own without the tax advantages they had in the past by obtaining health insurance through their employer. As a result, employers with relatively many high-income employees will be under pressure to keep their insurance, whereas an employer of middle- and low-income employees may find them asking for health insurance to be dropped from the employee benefit menu.

Administrative costs, rising premiums and other costs have already made a number of employers lukewarm about health insurance, but they offered it in order to attract employees who do not care to be uninsured or to end up on Medicaid. The new insurance opportunities that become available next year may give their employees enough of an alternative that the lukewarm employers can drop their plans.

Both of these situations are closely correlated across industries, which leaves me to suspect that we can readily predict the industries that will retain employer insurance and predict those that will drop whatever health benefits they currently have. The scatter diagram below displays Bureau of Labor Statistics data on several industries according to the percentage of their employees in families above three times the poverty line (horizontal axis) and the percentage of employers offering health benefits as of March 2012 (vertical axis).
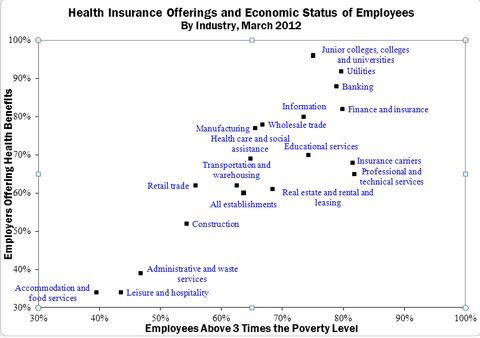
Bureau of Labor Statistics

I measured employees relative to three times the poverty line because that is the family income threshold beyond which the new exchange subsidies are less valuable than the income tax preference for employer-sponsored health insurance.

Industries like colleges, utilities and banking almost always offer health insurance, and about 80 percent of their employees will be getting a better deal on employer health insurance than they would from the exchange plans because their families are above three times the poverty line. For these reasons, I am confident that these industries will continue to offer health insurance to their employees in much the same way that they have in the past.

A couple of industries like “accommodation and food services” (i.e., restaurants), leisure and hospitality, administrative and waste services, and construction already have a mix of employers in terms of their health insurance offerings, so it would not be unusual from an industry perspective for those that currently have health plans to drop them during the next couple of years.

Moreover, the diagram shows how 45 to 60 percent of their employees do not come from families above three times poverty and therefore will have a significant federal health insurance subsidy waiting for them as soon as their employers drop coverage.

Employers that do not offer health insurance may be subject to penalties, but the penalties are not levied based on part-time employees, or levied on small employers, and even the penalties levied will be less than the subsidy opportunities created by an employer of middle- and low-income people that fails to offer health insurance.

For these reasons, I suspect that the stories we will hear about employers dropping insurance will disproportionately come from the industries shown in the lower left part of the scatter diagram, which collectively employ about 25 million people. Some employers in these industries have already discussed such plans.

Article source: http://economix.blogs.nytimes.com/2013/05/15/patterns-of-health-insurance-changes/?partner=rss&emc=rss

It’s the Economy: Who Knew Greenwich, Conn., Was a Model of Equality?

No, Bonilla told me. In Greenwich schools, he said, “they teach ice-skating.” His wife, Veronica Llerena, who works as a housekeeper and a cashier at a Peruvian restaurant, added, “They have everything — music, sports, art, drama.” She and Bonilla, who farmed a small plot in El Ejido in Andalusia, recently left because “in Spain, he has no future,” Bonilla said, pointing at their 4-year-old son, Manuel Jr., who was sleeping in his mother’s arms. In Greenwich, they thought he did.

The Bonillas were sitting with other low-income families in the immaculate Greenwich Head Start building. I had long known that Greenwich — with its grand estates — was ground zero for the 1 percent, but I was surprised to learn that nearly 4 percent of its residents live below the poverty line. “It takes a lot of labor to run those estates,” says Bob Arnold, president of Family Centers, a nonprofit social-service agency there. “They need housekeepers, cooks, landscapers.” I figured that many of those lower-income workers commuted from nearby places like White Plains, N.Y., or Stamford, Conn., where the rents are much cheaper. And many certainly do, but Arnold told me that the families who opt to live just on the Greenwich side of the New York border or in the apartments above the stores on Greenwich Avenue, fit a very specific profile: they pay the costs to have access to the schools that Greenwich’s high property-tax base affords.

What Greenwich doesn’t have is an abundance of affordable housing. Megan Sweeney, a director at Family Centers, explained that information about them is often guarded by family members or close friends. The Bonillas moved to Greenwich only because Veronica’s sister, Mercy Llerena, a manager of a private estate, went there from White Plains after marrying a man in town. Another woman I met, Estella Rozende, an immigrant from Brazil, learned about Greenwich from a family friend who has helped dozens get started there.

The Bonillas and Rozende felt lucky to have children in Greenwich. But historically speaking, researchers haven’t been so sure that it is beneficial to enroll low-income children in wealthier schools. A lot of sociological data, dating to the definitive Coleman Report of 1966, which studied the outcomes of 570,000 students, show that a child’s success in school, more than anything, was determined by her parents’ wealth and education level. So in the decades after the report was issued, attention was lavished on various reforms and integrating schools according to race, not economics.

New research, however, suggests that economic integration may be the answer. Recently, Heather Schwartz, a policy researcher at the RAND Corporation, began studying the public-school system of Montgomery County, Md. The county, a suburb of Washington, has one of the most affluent populations in America and an innovative housing authority that allows low-income citizens to rent homes alongside wealthier neighbors at steeply discounted prices. The renters are randomly assigned to different parts of the county; some Montgomery County schools have many poor students, others have almost none. In 2009, Schwartz concluded that students from poor families did much better in predominantly wealthy schools than in predominantly poor ones. On average, the poorer children in wealthier schools cut their achievement gap in half compared with their peers in poorer schools.

Article source: http://www.nytimes.com/2013/04/14/magazine/who-knew-greenwich-conn-was-a-model-of-equality.html?partner=rss&emc=rss

Economix Blog: Nancy Folbre: What Percentage Lives in Poverty?

DESCRIPTION

Nancy Folbre is an economics professor at the University of Massachusetts, Amherst.

Do poor people represent the bottom 16 percent of the population or the bottom 15 percent? The answer matters more than you might think.

Today’s Economist

Perspectives from expert contributors.

The difficulty of measuring economic well-being helps explain why it’s hard for people to figure out what economic percentile they belong to or which public policies would best serve their interests.

A difference of one percentage point in the overall poverty rate is no big deal. But the new Supplemental Poverty Measure, or S.P.M., developed by the Census Bureau, which yields the slightly higher overall estimate, shows lower rates of poverty among children and higher rates among the elderly than the traditional measure. An estimate based on a measure similar to the S.P.M. suggests that poverty has increased less over time.

The S.P.M. goes beyond consideration of money income to estimate the value of such in-kind transfers as food stamps, net taxes paid to government (taxes paid less the value of tax credits received), and medical and work-related expenses (such as child care and commuting costs). It also employs a new standard of need, linked to what low-income families actually spend.

Children are the beneficiaries of more of the in-kind transfers measured by the S.P.M. than people over age 65 and have fewer out-of-pocket medical expenses. As a result, they look less susceptible to poverty under the new measure than the traditional one, especially compared with older adults. Safety net programs such as food stamps expanded during the Great Recession.

Any income-based measure that takes such transfers into account is likely to show a smaller increase in poverty resulting from the recession than one that does not. Indeed, a good measure of poverty should register the impact of major public policies.

Unfortunately, the S.P.M. suffers some painful limitations. Like the traditional poverty measure, it understates the relative economic well-being of older adults because it ignores the value of their wealth – which doesn’t count as income although it can reduce or help cover their living expenses.

Also, some low-income families simply can’t afford expenditures on health and go untreated. They are not necessarily better off than similar families who spend money on health, though the S.P.M. might make them appear so.

Shawn Fremstad of the Center for Economic and Policy Priorities effectively details these shortcomings. But like others who acknowledge the S.P.M.’s limitations, including Arloc Sherman of the Center for Budget and Policy Priorities and Heidi Hartmann of the Institute for Women’s Policy Research, he agrees that it provides important new information.

Much depends on how researchers, journalists and public policy makers interpret the measure and how they explain the difficulties of measuring economic well-being.

The in-kind benefits that people receive from government go far beyond those measured in the S.P.M. and include big-ticket items such as spending on public education and Medicare expenditures. Tax benefits range from implicit tax subsidies for employer-provided health insurance to the mortgage-interest tax deduction.

The value of these benefits to individual families is not measured in any comprehensive survey. Both in-kind and tax benefits to the poor are more politically visible, and they phase out rapidly as family income increases above the poverty line, where both federal income and Social Security taxes begin to bite harder.

This differential visibility probably intensifies political resentments that some middle-income working families feel toward the poor.

Yet taking net taxes and work-related expenditures into account shows many families closer to the poverty line than they would otherwise seem. Using the traditional income-based measure, about 36 percent of Americans lived in families with income more than four times the poverty level in 2010. Using the S.P.M. measure of economic well-being, the size of that top group declines to 17 percent.

Major government transfers and benefits are directed at different age groups. As a result, age-based politics now greatly complicates political alignments based on class. Most individuals enjoy large transfers from the government as children (through public education) and as retirees (Social Security and Medicare) paying net taxes only as working-age adults. As a result, voters are often confronted by choices that might help them now but hurt them later, benefit their children or harm their parents.

We are now a demographically diverse population with enormous variation across households in the extent of time devoted to the care of dependents, whether children, individuals with health or disability problems, or the frail elderly. Yet we don’t factor either the costs or the benefits of this work time into estimates of family living standards.

When differences across income groups are extreme and increasing over time — as between the bottom 99 percent and the top 1 percent – they can trump these complexities.

But any political movement that aims to unify American voters must devise strategies to improve their standard of living. Such strategies should be informed by serious efforts to go beyond conventional measures of family income to develop more comprehensive measures of economic well-being.

Article source: http://feeds.nytimes.com/click.phdo?i=7155f47120d8927b8ab31f63288116b7

Israeli Cabinet Backs Outline for Social Change

The cabinet voted 21 to 8 to approve the outline of a report by a committee for socioeconomic change set up by the government and led by Manuel Trajtenberg, a respected professor of economics.

The report was welcomed by Prime Minister Benjamin Netanyahu when it was presented late last month. But when he tried to bring it to a vote last week, some of his coalition partners decided to flex their political muscle and raised objections, making it clear that Mr. Netanyahu had not lined up a majority beforehand.

One of the parties that objected last week, Yisrael Beiteinu, switched to support the committee’s plan this week after receiving promises that some of its own socioeconomic demands would be met; the change gave Mr. Netanyahu a comfortable majority in the vote on Sunday.

Another coalition partner, the ultra-Orthodox Shas party, which draws much of its support from low-income families, voted against the plan. So did the defense minister, Ehud Barak, and the minister of home-front defense, Matan Vilnai, who oppose the cuts to the defense budget that the committee has recommended to finance the plan.

The social movement began in mid-July when a group of young Israelis pitched tents in the center of Tel Aviv to protest inflated housing prices. The committee recommended building almost 200,000 apartments over the next five years, making more apartments available as rentals and increasing housing subsidies for the needy.

The panel also recommended raising taxes on the wealthy and on corporations, building more day care centers and providing free pre-kindergarten for children 3 to 5 years old.

Even so, leaders of the social protest movement criticized the report, saying it merely moved money around within the existing budget and did not call for more fundamental changes.

The committee’s outline must now be examined in more detail by the government and then be put to a vote in Parliament, a process that is expected to take several months.

Separately, the representatives of the international quartet of Middle East peacemakers met in Brussels on Sunday to follow up on their call for Israel and the Palestinians to resume peace talks in an effort to deflect the impact of a contentious Palestinian bid for recognition of statehood and membership in the United Nations.

The talks have been stalled for more than a year, with the Palestinians demanding a halt to all settlement construction before resuming negotiations and the Israelis insisting on talks with no preconditions. The quartet — the United States, the United Nations, the European Union and Russia — has called for talks without preconditions and has asked the sides “to refrain from provocative actions.”

Though there was no immediate sign of an end to the impasse, the European Union’s foreign policy chief, Catherine Ashton, said in a statement after Sunday’s meeting that the quartet would be “contacting the parties to invite them to meet in the coming days.”

Former Prime Minister Tony Blair of Britain, the quartet’s envoy, said: “We look forward to meeting with the parties shortly. This provides us with the opportunity to explore grounds for revived negotiations to take place.”

Ethan Bronner contributed reporting.

Article source: http://www.nytimes.com/2011/10/10/world/middleeast/israeli-cabinet-backs-panels-outline-for-social-change.html?partner=rss&emc=rss