April 19, 2024

Economix Blog: Four Years Later, 28,000 More Jobs

For jobs, the past four years have been a wash.

FLOYD NORRIS

FLOYD NORRIS

Notions on high and low finance.

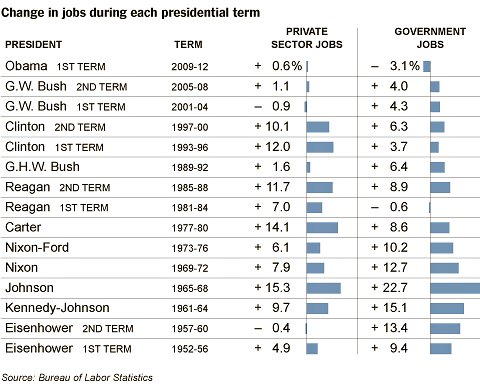
The December jobs figures out today indicate that there were 725,000 more jobs in the private sector than at the end of 2008 — and 697,000 fewer government jobs. That works into a private-sector gain of 0.6 percent, and a government sector decline of 3.1 percent.

In total, the number of people with jobs is up by 28,000, or 0.02 percent.

How does that compare? It is by far the largest four-year decline in government employment since the 1944-48 term. That decline was caused by the end of World War II; this one was caused largely by budget limitations. The only other post-1948 four-year drop was during Ronald Reagan’s first term, when government employment fell 0.6 percent.

Going back to Dwight Eisenhower, there have been only two administrations that turned in a worse performance in private-sector job growth. There were small declines in Eisenhower’s first term and in George W. Bush’s first term. Mr. Bush’s second term posted a scant 1.1 percent gain in private-sector employment — a gain that was wiped out during the first two months of 2009.

Over all, Mr. Obama’s first four years narrowly — and preliminarily — escaped being the second four-year presidential term since World War II to suffer net job losses. The first was George W. Bush’s first term.

The New York Times


A note on methodology. A month from now the Bureau of Labor Statistics will announce the final benchmark revision for the 12 months through March 2012. The preliminary estimate for that revision was that the economy gained 453,000 more private-sector jobs during the period than was previously reported, and lost 67,000 more government jobs. The calculations in this post incorporate those estimates.

The December figure will of course be revised for the next two months, and then will get a final revision in February 2014. Only then will it be clear whether the past four years had a net gain or loss in jobs.

Article source: http://economix.blogs.nytimes.com/2013/01/04/four-years-later-28000-more-jobs/?partner=rss&emc=rss

Economix Blog: Bankers’ Salaries vs. Everyone Else’s

Why are the Occupy Wall Streeters so angry at bankers? This chart might give you some idea:

DESCRIPTIONVia New York State Comptroller report.

That chart is from a new report from the New York State Comptroller’s office on the securities industry in New York City.

It shows that the average salary in the industry in 2010 was $361,330 — five and a half times the average salary in the rest of the private sector in the city ($66,120). By contrast, 30 years ago such salaries were only twice as high as in the rest of the private sector.

CATHERINE RAMPELL

CATHERINE RAMPELL

Dollars to doughnuts.

Last year helped contribute to the widening of that gap, too.

That’s not to say that bankers have job security.

The overall financial services sector was disproportionately hit by the financial crisis. The sector employs just 12 percent of the city’s work force, but accounted for one out of every three jobs lost in the recession. Some (not all) of those jobs were regained, but the comptroller’s office says the industry “is likely to experience significant job losses over the course of the next year.”

In particular, the securities sub-sector of financial services “could lose an additional 10,000 jobs by the end of 2012, which would bring total job losses in the industry to 32,000 since January 2008,” the report said.

Article source: http://feeds.nytimes.com/click.phdo?i=4df0eda5ba7f1035d6b1288ea644ff66

Payrolls Increased in 31 States in July, but Jobless Rate Rose in 28, New Data Shows

Employers in New York increased their staffs by 29,400 workers, while those in Texas added 29,300, figures from the Labor Department showed Friday. Joblessness increased by 0.4 percentage point in Illinois, Michigan, Minnesota and South Carolina. Nevada continued to lead the nation in unemployment with a rate of 12.9 percent.

Widespread job growth is needed to shore up incomes after spending among consumers ground to a halt in the second quarter. That raised concern that the world’s largest economy was stalling. A Labor Department report on Aug. 5 showed employers added 117,000 workers to payrolls last month and the jobless rate fell to 9.1 percent.

“The overall labor market was doing better than previous months, but the bigger point is that it’s a lot weaker than earlier in the year,” Paul Dales, senior United States economist at Capital Economics in Toronto, said before the report. “That’s a concern given that any data from July won’t reflect the market turmoil in the last couple of weeks that really could have prompted some businesses to postpone or cancel any hiring plans.”

After Nevada, the jobless rate was highest in California at 12 percent, and Michigan and South Carolina, both at 10.9 percent.

Payrolls in Michigan rose 23,000 and Tennessee gained by 14,300. They rounded out the top four states showing the biggest increase.

The biggest job losses last month occurred in Illinois, where employers cut payrolls by 24,900, and in Florida, which had a 22,100 decrease.

Over the last 12 months, six states lost jobs, including Indiana, Nevada, Kansas, Alabama, Georgia and Delaware.

The jobless rate in North Dakota, the lowest in the United States, increased to 3.3 percent from 3.2 percent in June.

While payroll growth picked up in July, employment prospects for Americans have dimmed compared with earlier in the year. Employers added 216,000 workers from May to July, compared with 646,000 in the previous three-month period.

The risk of a recession has risen to 30 percent from 14 percent in July, according to the median of the 39 economists in a Bloomberg News survey. A sell-off in stocks, government fiscal austerity and a lack of jobs will hurt American growth, which slowed to a 0.9 percent pace in the first half of 2011, the economists said.

State and local employment data are derived independently from the national statistics, which are typically released on the first Friday of every month. The state figures are subject to larger sampling errors because they come from smaller surveys, making the national figures more reliable, according to the Bureau of Labor Statistics.

Article source: http://feeds.nytimes.com/click.phdo?i=4c48bfacc2747cbfbc89e9fd0f8a9b28