December 22, 2024

Household Incomes Remain Flat Despite Improving Economy

“The poverty and income numbers are a metaphor for the entire economy,” said Ron Haskins of the Brookings Institution. “Everything’s on hold, but at a bad level.”

Over a longer perspective, the figures reveal that the income of the median American household today, adjusted for inflation, is no higher than it was for the equivalent household in the late 1980s.

For all but the most highly educated and affluent Americans, incomes have stagnated, or worse, for more than a decade. The census report found that median household income, adjusted for inflation, was $51,017 in 2012, down about 9 percent from an inflation-adjusted peak of $56,080 in 1999, mostly as a result of the longest and most damaging recession since the Depression. Most people have had no gains since the economy hit bottom in 2009.

The government’s authoritative annual report on incomes, poverty and health insurance, released Tuesday, underscores that the economic recovery has largely failed to reach the poor and the middle class, even as the unemployment rate continues to sink and growth has returned.

Government programs remain a lifeline for millions. Unemployment insurance, whose eligibility the federal government expanded in response to the downturn, kept 1.7 million people out of poverty last year. Food stamps, if counted as income, would have kept out four million.

Since the recession ended in 2009, income gains have accrued almost entirely to the top earners, the Census Bureau found. The top 5 percent of earners — households making more than about $191,000 a year — have recovered their losses and earned about as much in 2012 as they did before the recession. But those in the bottom 80 percent of the income distribution are generally making considerably less than they had been, hit by high rates of unemployment and nonexistent wage growth.

Moreover, economists believe that the report understates the degree of income inequality in the United States, by not including, among other things, earnings from capital gains made on rising stock prices.

In one glimmer of improvement, the number of men working full time year-round with earnings increased by one million from 2011 to 2012, to a total of 59 million. Still, the labor market continues to look weak, in particular for less-educated and lower-income men. The labor force participation rate of men has fallen steadily for the past 60 years. In no small part, that is because the median earnings of men working full time have not increased in real terms since the early 1970s.

For women, the earnings stall started about a decade ago, when the gender pay gap stopped closing. “The wage gap hasn’t budged a penny,” said Fatima Goss Graves of the National Women’s Law Center. “After 11 years of no progress on equal pay, policy makers need to get moving to improve the country’s pay discrimination laws, raise the minimum wage and remove the barriers women face in higher-wage jobs.”

The West was the only region that experienced a statistically significant increase in median income, the Census Bureau said, while all other regions were flat. That most likely reflects the relatively strong growth in Washington, Oregon, California and Utah last year. North Dakota, experiencing an oil and gas boom, is the fastest-growing state, though its population is so small that it barely affects the national statistics.

No racial or ethnic group experienced significant changes in income, but that left the gap between Asians, at the top, and blacks, at the bottom, as wide as before. The median income for Asian households was $68,600. For non-Hispanic whites, it was about $57,000, while the typical Hispanic household had an income of $39,000, and blacks were at $33,300.

Article source: http://www.nytimes.com/2013/09/18/us/median-income-and-poverty-rate-hold-steady-census-bureau-finds.html?partner=rss&emc=rss

U.S. Median Income Rises, but Is Still 6% Below Its 2007 Peak

The study, issued on Wednesday by two former Census Bureau officials, suggests why many people remain glum even though the economy is growing and unemployment has declined.

Although inflation-adjusted median annual household income rose to $52,100 in June, from its recent trough of $50,700 in August 2011, it remained $2,400 lower — a 4.4 percent decline — than in June 2009, when the recession ended. This drop, combined with the 1.8 percent decline that occurred during the recession, leaves median household income 6.1 percent — or $3,400 — below its level in December 2007, when the economic slump began.

Since the end of the recession, the study said, household income has declined for all but a few population groups. Some of the largest percentage declines occurred for groups whose income was already well below the median, like African-Americans, Southerners, people who did not attend college, and households headed by people under age 25.

“Groups with low incomes tended to have steeper declines in income,” said Gordon W. Green Jr., who wrote the report with John F. Coder, a colleague at Sentier Research, which specializes in analyzing household economic data.

Households headed by people ages 65 to 74 were the only group in the study that experienced a statistically significant increase in post-recession income, helped both by the continued increase in Social Security benefits and by the decision of some older workers to remain in the work force or re-enter it.

The figures, adjusted for changes in the cost of living over time, include income before taxes and exclude capital gains. The number of households with income above the median is the same as the number below it.

The data offers a potential preview of the official Census Bureau statistics on income and poverty for 2012, scheduled to be released next month. The Sentier data is based on the Current Population Survey, a monthly government survey of about 50,000 households. The researchers used the same definition of income as the Census Bureau uses in its annual report on income and poverty. The two sets of estimates have shown broadly similar trends in recent years.

Because recessions rarely match up perfectly with calendar years, the annual census data often does not allow for precise comparisons with the start and end of downturns. The most recent downturn ended in June 2009, according to a committee of academic economists widely considered to the arbiter of the business cycle.

The economy has been growing since 2009, but more slowly and inconsistently than many Americans would like and many economists and policy makers had predicted. President Obama has made the economy’s condition his main focus this summer, promising new efforts to encourage economic growth, including a series of proposals on higher education that he is expected to announce Thursday. While taking credit for some improvement in the economy, he has acknowledged that many Americans have yet to see the benefits.

“We’ve got more work to do,” Mr. Obama said last month at Knox College in Galesburg, Ill. “Even though our businesses are creating new jobs and have broken record profits, nearly all the income gains of the past 10 years have continued to flow to the top 1 percent. The average C.E.O. has gotten a raise of nearly 40 percent since 2009. The average American earns less than he or she did in 1999.”

In the recession and its aftermath, many people went back to school, earning associate or bachelor’s degrees. Such credentials have helped, the new data shows, but they have been no guarantee against loss of income.

Households headed by people with only a high school diploma have seen their post-recession income decline by 9.3 percent, to $39,300 in June of this year, the report said. For households headed by people with an associate degree, median income declined by 8.6 percent in those four years, to $56,400. And among households headed by people with a bachelor’s degree or more, median income declined by 6.5 percent, to $84,700.

Since the end of the recession, the report said, income has declined by 3.6 percent for non-Hispanic white households, to $58,000, and by 4.5 percent for Hispanic households, to $40,979. Those changes were smaller than the 10.9 percent decline, to $33,500, for non-Hispanic black households, whose economic problems are likely to be a focus when Mr. Obama speaks next week on the 50th anniversary of the March on Washington.

Median income for households headed by people 65 to 74 years old increased by 5.1 percent, to $43,000, even though in many cases the head of the household was retired. By comparison, median income for households headed by people under age 25 fell 9.6 percent in the last four years, to $31,300.

Median income declined by 4.5 percent for households headed by a person 25 to 34 years old, by 5.7 percent for those 35 to 44, by 2.5 percent for those 45 to 54, and by 7 percent for those 55 to 64. The report found no significant change for households headed by a person 75 or older.

Median income declined for households in three of the four major geographic regions, with the South showing the largest decline and the Midwest reporting no statistically significant change.

From June 2009 to June of this year, household income declined by 6.2 percent in the South, to $47,900; by 5.2 percent in the West, to $56,400; and by 3.9 percent in the Northeast, to $56,800.

By contrast, household income in the Midwest, $52,600, was not significantly different from what it was four years ago. Some parts of the Midwest have been helped by the natural-gas boom, while others have benefited from a modest manufacturing rebound in the last few years.

Article source: http://www.nytimes.com/2013/08/22/us/politics/us-median-income-rises-but-is-still-6-below-its-2007-peak.html?partner=rss&emc=rss

Bucks Blog: A Freddie Mac Rule Change May Help Some Borrowers

A change in Freddie Mac’s rules could help retiring baby boomers, and other home buyers with limited incomes but substantial financial assets, qualify for low-rate conventional mortgages.

Freddie Mac, the giant mortgage finance company, actually changed the rule two years ago. But many borrowers and loan underwriters are apparently unaware of it, according to a blog post on the company’s Web site.

Why would someone near or in retirement want to take on a mortgage? They may want to refinance an existing loan at a lower rate. Or, they may want to sell and downsize to a smaller property. The slow housing market and depressed home values have made that difficult for some, until recently.

Now, the housing market is improving, values are rebounding, and interest rates are still relatively low. Those improvements, plus the more expansive income eligibility criteria, may help more people move into new loans, said Brad German, a spokesman for Freddie Mac.

“Perhaps someone was waiting for home prices to come back so they could sell their home and responsibly combine part of the sale proceeds with a mortgage to buy a smaller home or a retirement home,” he said in an e-mail.

The change allows lenders to take into account a significant portion of a borrower’s financial assets when determining if their income qualifies them for a Freddie Mac mortgage. (Freddie Mac doesn’t make loans directly; rather, it buys them and pools them for sale to investors, and guarantees them against default.)

For instance, under the new guidelines, a portion of assets like individual retirement accounts (I.R.A.’s) and 401(k)s can count toward a borrower’s income eligibility.

The assets must be in a fully vested retirement account recognized by the Internal Revenue Service, and they can’t be subject to a withdrawal penalty. (The change doesn’t apply to accounts that are already being tapped, since that means they’ve already been taken into account in the borrower’s income.)

To determine eligibility, the lender adds up the eligible assets; multiplies the total by 70 percent; and subtracts the funds needed to complete the transaction, like down payments, closing costs and escrows. Then, the remaining amount is divided by 360 months, and counted toward the borrower’s monthly income.

Say you had an I.R.A. worth $100,000 and a down payment of $20,000, leaving $80,000 in assets to be used to determine your income for qualifying purposes. Seventy percent of $80,000 leaves $56,000, which is divided by 360 months, leaving roughly $155 a month added to your income.

The assets are separate from dividends, interest payments, trust distributions and Social Security payments, which have long been eligible for consideration when calculating a borrower’s qualifying income.

The new requirements are “a potentially big deal” for many prospective home buyers, including the “rapidly growing” population of retirees and near-retirees who would like to buy or refinance a home, Freddie Mac says.

“We want to make sure people know about this option,” Mr. German said.

Would this rule change help you obtain a mortgage?

Article source: http://bucks.blogs.nytimes.com/2013/05/24/a-freddie-mac-change-may-help-some-borrowers/?partner=rss&emc=rss

Part-Time Work Becomes Full-Time Wait for Better Job

In March, 7.6 million Americans who want more hours were stuck in part-time jobs, about the same as a year earlier and three million more than there were when the recession began at the end of 2007.

These almost invisible underemployed workers do not count toward the standard jobless rate of 7.6 percent. A broader measure, which includes the involuntary part-timers as well as people who want to work but have stopped looking, stands at 13.8 percent.

“There’s nothing inherently wrong with people taking part-time jobs if they want them,” said Diane Swonk, chief economist at Mesirow Financial in Chicago. “The problem is that people are accepting part-time pay because they have no other choice.”

Even for those who have been able to take advantage of the better job market, the opportunities have not been good. Since the economy began to recover almost four years ago, hiring has been concentrated in relatively low-wage service sectors, like retailing, home health care, and food preparation, and in contingent jobs at temporary-hiring companies. For example, nearly one out of every 13 jobs is at a restaurant, bar or other food-service establishment, a record high.

Household incomes have been stagnant throughout the recovery, and actually fell in the latest report, according to Sentier Research. As a result, economists and policy makers have been expressing concerns about not only the pace of hiring but the quality of new jobs as well.

“It’s important to look at the types of jobs that are being created,” Sarah Bloom Raskin, a member of the Federal Reserve Board, said in a recent speech. “Those jobs will directly affect the fortunes and challenges of households and neighborhoods as well as the course of the recovery.”

While increases in part-time and temporary work can sometimes be an early sign that employers will soon take on more permanent hiring, many workers have been trapped in such jobs far longer than they had anticipated.

Part-time work rose rapidly in the recession and early parts of the recovery, and it has not let up much. Today, 19.1 percent of workers say they usually work part time, defined as fewer than 35 hours a week, versus 16.9 percent when the recession started.

Essentially all of the gains in part-time employment have been among people who are reluctantly working fewer hours because of slack business conditions for their employer or an inability to find a full-time job.

“It was a relief just to find something,” said Amie Crawford, 56, of Chicago. After four months looking for a new job as an interior designer, which she had been for 30 years before the recession, she accepted a position as a part-time cashier at a quick-service health-food cafe called Protein Bar.

She keeps asking for more hours, but her manager’s response is always the same.

“He tells me, ‘I try to give you as many hours as I can, but everybody wants as many hours as they can,’ ” Ms. Crawford said.

The owner of the company, Matt Matros, said that it was working on giving her more hours, but that each location had a limited need for cashiers. He added that Ms. Crawford had the opportunity to get trained in other skills if she wanted to advance or take on other positions.

Holding a part-time job when a full-time one is desired is frustrating for workers, and not only because fewer hours means less income. Like temp workers, part-timers are also less likely to get benefits and are more likely to be stuck with unpredictable schedules that make it hard to plan for child care, transportation or even a second part-time job.

“I’ll be on the schedule from this time to this time, so I expect to work from this time to this time,” Ms. Crawford said. “But because on a particular day, who knows, it’s snowing, raining, or people just didn’t come in today for whatever reason, they start cutting people. So I get sent home in the middle of my shift.”

Part-timers also generally earn less per hour than their full-time counterparts.

“The only remaining legal form of discrimination in the labor market is against part-time workers,” said John Schmitt, senior economist at the Center for Economic and Policy Research, a liberal research organization. “You can hire part-time workers and full-time workers doing the same job, and you’re allowed to pay them different money and different benefits.”

There are multiple reasons for an increased reliance on part-timers, primarily continuing low demand and uncertainty about the economy.

Article source: http://www.nytimes.com/2013/04/20/business/part-time-work-becomes-full-time-wait-for-better-job.html?partner=rss&emc=rss

Off the Charts: In World Trade Data, Signs of a Slowdown

The accompanying charts show the change in exports and imports of goods in 12 large countries — the industrialized countries in the Group of 7, in addition to Australia and four emerging economies, China, Brazil, India and South Korea. All figures are in United States dollars.

Of the 12, only China, with an 8 percent gain, posted faster growth in exports than the United States. Canada reported a small gain, but the others showed declines. In their local currencies, South Korea and India had gains, but they were erased by the decline of those currencies against the dollar.

Import totals can provide an indication of economic woes, as declining incomes cause consumers to buy less, including fewer items from abroad. Imports fell in Germany, France and particularly Italy. This week, the European Union reported that the euro zone economy declined in the fourth quarter — the third consecutive fall. Germany’s economy, which had been growing slowly, also shrank.

In the United States, imports of goods rose just 3 percent in 2012. It was the second consecutive year, and the sixth year in the last seven, that exports grew more — or, in 2009, shrank less — than imports. Before that, imports rose faster than exports for eight consecutive years, from 1998 through 2005.

The United States runs a trade surplus in services, not shown in the chart, but the trade deficit in goods widened slightly in 2012 to $727.9 billion. That figure is still well below the deficits from 2004 through 2008, before the credit crisis and recession caused international trade to decline rapidly in 2009. The strong gains many countries experienced in 2010 and 2011 reflected a return to more normal levels.

Exports plunged in all countries during the crisis, but the trends since then have varied. German exports in 2012 were 3 percent lower than in 2008, while French exports were off almost 8 percent. Japanese and British exports were about 2 percent higher. The United States, by contrast, reported exports of goods in 2012 that were up 20 percent from 2008, and Brazilian exports were 23 percent higher.

Those gains pale next to those of developing Asian economies. South Korean exports in 2012 were 30 percent higher than in 2008, while China bolstered its shipments by 43 percent. Indian exports were 50 percent higher.

The charts also show changes in American trade with the other 11 countries listed. Exports to most of the European countries fell in 2012, but exports to France rose sharply. France has resisted austerity more than most of its neighbors, something that may have contributed to the rise.

Floyd Norris comments on finance and the economy at nytimes.com/economix.

Article source: http://www.nytimes.com/2013/02/16/business/economy/in-world-trade-data-signs-of-a-slowdown.html?partner=rss&emc=rss

Today’s Economist: Casey B. Mulligan: Earned-Income Ironies

DESCRIPTION

Casey B. Mulligan is an economics professor at the University of Chicago. He is the author of “The Redistribution Recession: How Labor Market Distortions Contracted the Economy.”

The “earned income tax credit” is, ironically, more likely to be received by unemployed people than by workers who do not spend any time unemployed.

Today’s Economist

Perspectives from expert contributors.

The credit was created years ago to reduce tax burdens on the poor and to “provide a genuine incentive for working;” a household must have some wage and salary income in order to receive the credit.

However, because the credit is administered on a calendar-year basis and is phased out with calendar-year wages and salaries, it is disproportionately received by people unemployed after a layoff.

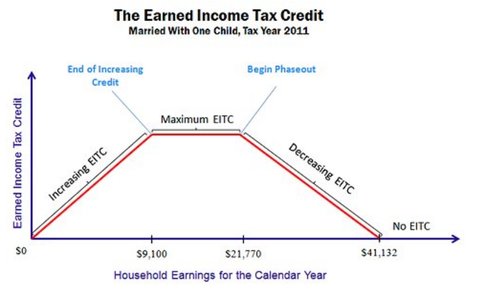
As I illustrated in an earlier post, the credit follows a mountain-plateau pattern: an increasing portion for the lowest calendar incomes, a flat portion, a decreasing portion and then a flat portion of zero.

Internal Revenue Service

You might think that unemployed people do not receive the credit because they do not have any wage or salary income, but typically people unemployed from layoff do have wages or salary income during the calendar year of their unemployment from their previous job. Their layoff might have occurred after the beginning of the calendar year. Even a layoff occurring in December of the previous year might generate wage and salary income in the current year because of a severance payment or accumulated sick and vacation pay.

Moreover, an unemployed person might have a spouse with wage and salary income, and the spouse’s income counts toward the credit.

Because unemployment compensation is supposed to be reported on the recipient’s federal individual income tax return, I was able to further investigate this issue by examining a large sample of individual income tax returns for the years 2000-07 provided by the Internal Revenue Service to the National Bureau of Economic Research and other institutions for research purposes.

In 2007, 97 percent of the 7.6 million returns showing unemployment-compensation income (that is, the taxpayer or spouse was unemployed and receiving benefits some time during the calendar year) also had wage and salary income during the year. That percentage was essentially the same in each of the years 2000-06.

Of the same 7.6 million returns with unemployment income in 2007, one quarter received the earned income tax credit. By comparison, the credit was received by only one-sixth of the returns with wage and salary income but no unemployment income.

Among returns with unemployment income, the average earned income tax credit was $486, compared with $347 among the returns with wages but not unemployment income.

For most of the returns with both unemployment income and the earned income tax credit, the credit would have been even greater if the taxpayer had been employed fewer weeks than he or she actually was. Still more returns with unemployment income but no earned income tax credit would have received the credit if the unemployment had lasted longer.

This situation occurs so often because unemployment benefits are based on a person’s weekly work situation while the earned income credit is based on a household’s annual wages and salaries, and because weekly unemployment benefits by themselves are usually less than weekly wages and salaries.

The earned income tax credit is thus a good example of how a so-called tax credit can act like a tax from a working person’s point of view.

Article source: http://economix.blogs.nytimes.com/2013/02/06/earned-income-ironies/?partner=rss&emc=rss

Japan Approves $116 Billion in Emergency Economic Stimulus

TOKYO — The Japanese government approved emergency stimulus spending of more than $100 billion on Friday, part of an aggressive push by Prime Minister Shinzo Abe to kick-start growth in Japan’s long-moribund economy.

Mr. Abe also reiterated pressure on Japan’s central bank to make a firmer commitment to stopping deflation by pumping more money into the economy — a measure the prime minister says is crucial to getting businesses to invest and consumers to spend.

“We will put an end to this shrinking, and aim to build a stronger economy where earnings and incomes can grow,” Mr. Abe told a televised news conference. “For that, the government must first take the initiative to create demand, and boost the entire economy.”

Under the plan, the Japanese government will spend about 10.3 trillion yen (about $116 billion) on public works and disaster mitigation projects, subsidies for companies that invest in new technology and financial aid to small businesses.

The government will seek to raise real economic growth by 2 percentage points and add 600,000 jobs to the economy, Mr. Abe said. The measures announced Friday amount to one of the largest spending plans in Japan’s history, he stressed.

By simply talking about stimulus measures, Mr. Abe, who took office late last month, has already driven down the value of the yen, much to the relief of Japanese exporters whose competitiveness benefits from a weaker currency.

But the government’s promises to spend its way out of economic stagnation also raise concerns over Japan’s public debt, which has already mushroomed to twice the size of its economy and is the largest in the industrialized world.

At the root of Japan’s debt woes was a similar attempt in the 1990s by Mr. Abe’s own Liberal Democratic Party to stimulate economic growth through government spending on extensive public works projects across the country.

Mr. Abe said, however, that the spending this time around would be better focused to bring about growth through investment in innovation. He said the government would also invest in measures that would help mitigate the fall in Japan’s population, by encouraging families to have more children.

“To grow in a sustainable way, we must help create a virtuous cycle where companies actively borrow and invest, and in so doing raise employment and incomes,” Mr. Abe said.

“For that, it is extremely important that we adopt a growth strategy that gives everyone solid hope that the future of the Japanese economy lies in growth.”

Article source: http://www.nytimes.com/2013/01/11/business/global/japan-approves-116-billion-in-emergency-economic-stimulus.html?partner=rss&emc=rss

After Fiscal Deal, Tax Code May Be Most Progressive Since 1979

The last-minute deal struck by the departing 112th Congress raised taxes on a handful of the highest-earning Americans, with about 99.3 percent of households experiencing no change in their income taxes. But the Tax Policy Center estimates that the average family in the top 1 percent will pay a federal tax rate of more than 36 percent this year, up from 28 percent in 2008. That is the highest rate since 1979, at least.

By some measures, the tax code might now be the most progressive in a generation, tax economists said, while noting that every American is paying a lower burden currently than they did then. In fact, the total federal tax rate is still vastly lower for the very rich than it was at any point in the 1940s through 1970s. It has risen from historical lows, but is still closer to those lows than where it was in the postwar decades.

“We made the system more progressive by raising rates at the top and leaving them for everyone else,” said Roberton Williams of the Tax Policy Center, a research group based in Washington. “The offsetting issue is that the rich have gotten a lot richer.”

Indeed, over the last three decades the bulk of pretax income gains have gone to the wealthy — and the higher up on the income scale, the bigger the gains, with billionaires outpacing millionaires who outpaced the merely rich. Economists doubted that the tax increases would do much to reverse that trend.

With the recovery failing to improve incomes for millions of average Americans and the country running trillion-dollar deficits, President Obama made “tax fairness” a centerpiece of his re-election campaign. In the heated negotiations with House Speaker John A. Boehner, that translated into the White House’s insistence on tax increases for the top 2 percent of households and a continuation of tax breaks and cuts for a vast number of taxpayers.

Republicans resisted increasing tax rates and aimed for lower revenue targets, arguing that spending was the budget’s primary problem and that no American should see his or her taxes go up too much in such a sluggish economy. But ultimately they relented, and Congress cut a last-minute deal.

“A central promise of my campaign for president was to change the tax code that was too skewed towards the wealthy at the expense of working middle-class Americans,” Mr. Obama said after Congress reached an agreement.

That deal includes a host of tax increases on the rich. It raises the tax rate to 39.6 percent from 35 percent on income above $400,000 for individuals, and $450,000 for couples. The rate on dividends and capital gains for those same taxpayers was bumped up 5 percentage points, to 20 percent. Congress also reinstated limits on the amount households with more than $300,000 in income can deduct. On top of that, two new surcharges — a 3.8 percent tax on investment income and a 0.9 percent tax on regular income — hit those same wealthy households.

As a result of the taxes added in both the deal and the 2010 health care law, which came into effect this year, taxpayers with $1 million in income and up will pay on average $168,000 more in taxes. Millionaires’ share of the overall federal tax burden will climb to 23 percent from 20 percent.

The result is a tax code that squeezes hundreds of billions of dollars more from the very well off — about $600 billion more over 10 years — while leaving the tax burden on everyone else mostly as it was. And the changes come after 30 years of both Republican and Democratic administrations doing the converse: zeroing out federal income taxes for many poor working families while also reducing the tax burden for households on the higher end of the income scale.

“Back at the end of the Carter and beginning of the Reagan administrations, we had a pretty severe income-tax burden for people at a low level of income. It was actually kind of appalling,” said Alan D. Viard, a tax expert at the American Enterprise Institute, a right-of-center research group in Washington. “Policy makers in both parties realized that was bad policy and started whittling away at it” by expanding credits and tinkering with tax rates.

After those changes and the new law, comparing average tax rates for poor households and wealthy households, 2013 might be the most progressive tax code since 1979. But economists cautioned that measuring progressivity is tricky. “It’s not like there is some scientific measure of progressivity all economists agreed upon,” said Leonard E. Burman, a professor of public affairs at Syracuse University. “People look at different numerical measures and they’ve changed in different ways at different income levels.”

Mr. Viard said that over time the code had become markedly more progressive for the poor compared with the middle class. But it arguably did not become much more progressive for the rich compared with the middle class, or the very rich compared with the rich, in part because of the George W. Bush-era tax cuts on investment income.

An anesthesiologist who earns a $500,000 salary subject to payroll and income taxes might pay a higher tax rate than a hedge fund manager making $1 billion subject mostly to capital-gains taxes, for instance.

Economists are also divided on the ultimate effect of those tax increases on the wealthy to income growth and income inequality in the United States. The recession hit the incomes of the rich hard, but they have snapped back much more strongly than those for middle or low-income workers.

“I’d still rather be really rich, even if I’m getting taxed much more than a low-income person” would be, Mr. Williams of the Tax Policy Center added.

Article source: http://www.nytimes.com/2013/01/05/business/after-fiscal-deal-tax-code-may-be-most-progressive-since-1979.html?partner=rss&emc=rss

Washington Deadlock Hurts Consumer Confidence

Consumer confidence in the first half of December took a sharper-than-expected dip, falling to its lowest level since August, according to a new survey released Thursday by the Conference Board. Wall Street also registered its frustration with the stalemate in Washington on Thursday, sending stocks sharply lower before recovering late in the day.

The gloom comes despite signs the economy has been holding up recently during the rising worries — other data released Thursday showed a healthy gain in new-home sales and a slight drop in new jobless claims. Indeed, the Conference Board’s data show consumer anxiety is centered on the outlook ahead for the economy, rather than on current conditions.

“People are realizing that we may not get a compromise and they’re getting nervous,” said Guy Berger, United States economist with RBS Securities. “It’s a precarious situation. So far consumers are worried about the future. Once they start worrying about the present, we’re in trouble.”

If Congress and President Obama cannot agree on a deal to cut the deficit by Jan. 1, more than $500 billion in tax increases and spending cuts are set to take effect.

Taxes have been the main sticking point — while the president favors eliminating Bush-era tax cuts on incomes over $250,000 and preserving current rates for lower incomes, many Republicans have been wary of supporting any tax increase. Republicans have been pushing for deeper spending cuts, something many Democrats have resisted.

Both sides remained dug in, and at midday Thursday Senator Harry Reid of Nevada, the Democratic majority leader, said he thought it was unlikely a compromise would be reached before Jan. 1.

With Wall Street tracking every turn of negotiations in Washington, shares tumbled after Mr. Reid’s remarks but recovered later in the day after reports the House would reconvene Sunday and take up the issue. The Standard Poor’s 500-stock index fell 1.73 points, to 1,418.10, while the Dow Jones industrial average sank 18.28 points, to 13,096.31

While an eventual deal that blunts part of the effect is expected in the coming weeks, some fallout from missing the Tuesday deadline will be felt right away — including a two percentage point increase in payroll taxes as well as the end of unemployment benefits for more than two million Americans. All that has increased the uncertainty for individuals, who until recently had shrugged off the fiscal standoff in Washington.

“Expectations have certainly shifted and it seems like consumer attitudes have caught up with business confidence,” said Michael Griffin, executive director at Corporate Executive Board, a member-based advisory firm. Surveys by the group have shown business sentiment weakening for three consecutive quarters, he said.

Consumers have had reasons to be more optimistic lately. After a deep decline caused by the housing bubble, home prices have begun to recover in many parts of the country. And the job market has been showing signs of improvement, with unemployment hitting a four-year low of 7.7 percent in November.

On Thursday, the Labor Department reported that initial claims last week for state unemployment benefits fell by 12,000, to a seasonally adjusted level of 350,000. Figures for jobless claims have been volatile since Hurricane Sandy, but the four-week moving average for new unemployment claims now stands at its lowest point in nearly five years. Sales of new single-family homes in November rose 4.4 percent, to a seasonally adjusted annual rate of 377,000, according to the Commerce Department.

By contrast, the Conference Board’s consumer confidence index fell to 65.1 in December from 71.5 in November. That was much sharper than the 1.5 point drop economists had been expecting. The board’s expectations index was off more sharply, sinking to 66.5 from 80.9 in November.

Several economists said the current situation recalls the standoff over raising the federal debt ceiling in the summer of 2011. In that case, too, consumer confidence eroded as both sides in Washington refused to blink until the last moment, but experts added the consequences were likely to be longer-lasting this time because the changes in tax policy affect individuals directly.

“In a lot of ways, this is a replay of the summer of 2011,” Mr. Berger said. “But it’s more serious this time.”

The longer the stalemate continues, the deeper the damage, economists said.

“It takes a while for consumer confidence to go up but it takes just a short while for consumer confidence to go down,” said Chris G. Christopher Jr., senior principal economist at IHS Global Insight. “The fiscal cliff has put a damper on things, and retailers are going to feel it in December.”

“As we get closer to Jan. 1, and the political rhetoric gets ramped up, people get worried,” he said.

Article source: http://www.nytimes.com/2012/12/28/business/economy/weekly-jobless-claims-fall.html?partner=rss&emc=rss

Inside Asia: Deflation a Determined Foe in Japan

TOKYO — The war against deflation in Japan will start with a battle for the pocketbooks of recession-hardened consumers like Kumiko Kuramochi.

The Liberal Democratic Party, which stormed to an election victory Sunday, hopes to convince Ms. Kuramochi and other Japanese that an aggressive monetary policy is going to cause inflation.

The message: Buy now before prices start rising.

The problem, though, is that a bargain-hunting psychology is so entrenched in Japan — after two decades of stop-start economic growth, 15 years of falling wages and nearly 15 years of deflation — that the government will struggle to convince people that their incomes will improve enough for them to buy more expensive goods.

Ms. Kuramochi, 38, is typical. With two small children in tow, she was shopping for bargains in eastern Tokyo before the election. Worried that her husband’s salary as a pipe layer could be cut next year, she is pulling back on spending.

“I bought winter coats for myself and one of my kids during a sale, because we try to limit how much we spend,” Ms. Kuramochi said. “I’m worried about the finances. Money is tight, and I don’t expect my husband’s income to get better next year, because the economy isn’t doing well.”

The problem of how to reverse Japan’s long-running deflation has become the defining economic issue for Shinzo Abe, leader of the Liberal Democratic Party.

Mr. Abe has vowed to end the era of falling prices and slumping demand in Japan, which is in its fourth recession since 2000, through “unlimited” bond purchases by the Bank of Japan. The argument is that that will create inflation expectations, which will translate into consumption and, in turn, greater economic growth.

Classical economics would argue that consumers should welcome deflation, because it increases their purchasing power, and that people hunt for bargains in earnest only when they worry that prices will rise.

But in Japan’s case, data show that purchasing power has been falling faster than prices. Average earnings in Japan have fallen 12.2 percent since the 1997 fiscal year, while a core measure of consumer prices — excluding food and energy — has fallen 6.8 percent.

In addition, consumers have spent so many years worrying about incomes and job security that finding ways to spend less has become a habit.

“Our finances will improve next year when my wife goes back to work, but we still plan to buy the cheapest goods we can find,” said Yuichi Kawakami, 43, a freelance graphic designer. “I worry about prices, because the economy isn’t doing well. We also need to save for expenses down the road.”

Mr. Kawakami, who was playing with his 1-year-old daughter in a coffee shop, said he and his wife used the Web site Shufoo to compare prices at supermarkets in their neighborhood to find the cheapest goods.

Japanese daytime television regularly celebrates the bargain hunter: the young housewife who compares prices at three different supermarkets before she buys; the salarymen and office ladies who line up to buy a ¥300, or $3.58, bento box lunch; the retiree who worries that the pension system will collapse.

Retailers play their part, discounting constantly to lure customers. That has partly been made possible because the strong yen — which has risen close to 50 percent against the dollar in the last 20 years — has made many imports cheaper.

The result is that shoppers are always looking for a bargain and will chase down the cheapest price they can find. Ito-Yokado, where Ms. Kuramochi had been shopping, made a big splash with shoppers this month by slashing prices on some goods as much as 40 percent. It sells fresh food, daily necessities, cosmetics, furniture and clothes.

Some economists support Mr. Abe’s argument that the central bank needs to ease monetary policy more aggressively to help end deflation.

However, many other economists say Japan needs to make structural changes to its economy by shifting employment to services from manufacturing, encouraging more employment of women and getting families to have more children to stop the population from shrinking.

Data from the Bank of Japan underline the uphill task confronting Mr. Abe.

In September, 62 percent of people in the central bank’s quarterly household survey said they expected prices to rise a median 3 percent over the following year.

But 94 percent expected their wages to remain the same or fall, and 96 percent expected to maintain their spending levels or cut them. The survey has shown the same underlying trend for nearly 20 years.

Concerns over higher prices for energy and food could explain the inflation expectations, but the survey does not ask about specific goods, a Bank of Japan official said. What the survey does show is that households plan to spend less when they expect incomes to stagnate, which has a direct and negative effect on the economy, said the official, who was not authorized to speak to the news media and so asked not to be identified.

Discretionary spending remains under intense pressure. An annual survey by Shinsei Bank compiled in September showed that the average monthly spending money available to a Japanese salaryman was down to its lowest level in 30 years in 2011.

The pressure to discount has created a prisoner’s dilemma for Japanese retailers. Restaurant chains and retailers would prefer to sell their goods without discounts, but there is little reason to trust that rivals will not try to cut prices first to poach customers. That logic ignites price wars.

Yoshinoya Holdings, which oversees a popular fast-food chain, cut the price of gyudon, or stewed beef over rice, at a few new stores it opened. A company spokesman said the price cut, to ¥250 a bowl from the usual price of ¥380, had been an “experiment.”

Weeks later, a rival chain cut its prices to ¥250 to match Yoshinoya’s.

“Companies realize that cutting prices is a war of attrition, and we see signs that companies want to get out of this pattern,” said Toshihiro Nagahama, chief economist at Dai-Ichi Life Research Institute. “Expectations for falling wages have become entrenched. However, if they think wages will rise, then people will react logically and spend more.”

Article source: http://www.nytimes.com/2012/12/18/business/global/deflation-a-determined-foe-in-japan.html?partner=rss&emc=rss