April 26, 2024

Economix Blog: Uwe E. Reinhardt: Debating Doctors’ Compensation

DESCRIPTION

Uwe E. Reinhardt is an economics professor at Princeton. He has some financial interests in the health care field.

Two themes run through the comments on previous blog posts that touched on the payment of the providers of health care. The first is that American doctors are paid too much. The second is that they are paid too little.

Today’s Economist

Perspectives from expert contributors.

Could both propositions be right? Let us explore the issue by looking at some numbers.

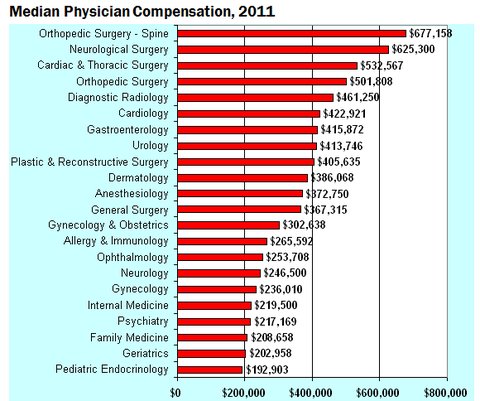
Figure 1, below, presents data on the median compensation reported by the American Medical Group Association for 2011. (The report shows data for many more specialties than can be shown in the chart.)

American Medical Group Association


The American Medical Group Association is the national association of more than 130,000 doctors practicing in large medical specialty groups. Its data are very close to the median compensation data for doctors reported by the professional group-practice administrations represented by the national Medical Group Management Association.

As is regularly reported by the trade journal Modern Healthcare, data on median or average doctors compensation can vary significantly, depending on who does the survey, the sample they survey and the response rates they achieve (you can see this by clicking on the chart to the right of the headline on this page). I personally view the American Group Medical Association and the Medical Group Management Group data as the most reliable.

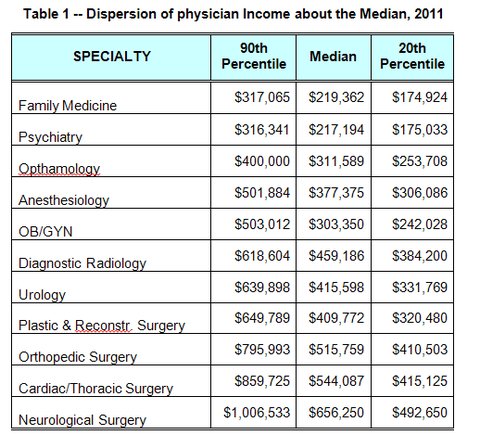
As we saw in Figure 1, the median compensation of doctors varies considerably among medical specialties in any given year. There is also a wide dispersion of compensation figures about the median for any given specialty, as is shown in Table 1. These data came from the previously cited American Medical Group Association survey.

American Medical Group Association

The dispersion of doctor  incomes is apt to be even wider if one includes not only physicians practicing in large medical groups but all practicing doctors.

Depending on their specialty, age, gender, whether they practice individually, in small groups or large groups and, most importantly, where they practice, a good many American doctors – especially primary-care physicians — probably do struggle to meet payroll, other practice costs and malpractice premiums and still have enough net income to support a family. This is especially so because as self-employed business professionals they do not get the fringe benefits available in formal employment in larger firms, and a good number of them have to repay principal and interest on educational debt that now averages $150,000 or so by the time residency training is over.

Over the last decade, the net incomes especially of primary-care doctors have hardly grown at all and even declined somewhat in inflation-adjusted dollars.

On the other hand, we read in the press that medical professionals are well represented in the top 1 percent of income earners in the United States. The ABA Journal of the American Bar Association reports that doctors outrank lawyers in that lofty cohort.

It should be noted, however, that one’s income does not have to be astronomical to rank among the top 1 percent of earners. A report on Bankrate.com noted that according to a model run by the Tax Policy Center and the Urban Institute, an income above $533,000 put one into the top 1 percent of earners in 2011.

So, what is one to make of these data on doctor incomes?

Are American doctors overpaid, as is sometimes argued, often with reference to physician incomes in other countries?

Or are American doctors underpaid, as about half of the physicians seem to think?

On this question, one can entertain several theories.

Standard economic theory suggests that over all, American doctors are overpaid, although perhaps not the primary-care specialties. This position leans on the fact that at existing incomes there is still considerable excess demand for places in medical schools among bright American youngsters – not to mention a huge pool of highly qualified foreign applicants. This suggests that the lamented doctor shortage in the United States is the result of an artificially constrained supply of medical school places and residency slots, which serves to inflate physician incomes above what they would be in a better functioning market without supply constraints.

As noted earlier, the idea that American doctors seem overpaid is often supported also with reference to what physicians in other countries are paid. Dana Goldman, an economist at the University of Southern California, for example, was quoted to that effect in an article in The New York Times.

My own view is that if one wants to go down that line of argument, the relevant comparison should not be doctors in other countries, but the incomes earned in the United States by members of the talent pool from which American physicians are recruited, a group that includes many who end up in the superbly well-remunerated financial markets, where they are well paid almost independently of their actual net contribution to society.

This position draws on the comparable-worth theory of compensation.

One can cite work by Christopher Conover of Duke University, who has estimated that the rate of return on the investment in human capital (i.e., education and training) to become a doctor is attractive – especially for the higher-paying medical specialties – but it is not as high as the rate earned on human-capital investments for other professions.

That finding, however, does not speak directly to the issue whether on average American physicians are over- or underpaid.

When in doubt, it may be wise to turn to the father of modern economics, Adam Smith. In “The Wealth of Nations” (published in 1776) he opined in Chapter 10:

We trust our health to the physician; our fortune and sometimes our life and reputation to the lawyer and attorney. Such confidence could not safely be reposed in people of a very mean or low condition. Their reward must be such, therefore, as may give them that rank in the society which so important a trust requires. The long time and the great expense which must be laid out in their education, when combined with this circumstance, necessarily enhance still further the price of their labor.

So when it came to contemplating the payment of doctors, Smith seems to have checked in his favored demand-and-supply framework at the door and slouched toward the medieval doctrine of just price. In my weaker moment, I slouch that way, too, as, I suspect, do many other economists, although my sentiment in this regard stops short of “lawyers and attorneys.”

Article source: http://economix.blogs.nytimes.com/2013/05/24/debating-doctors-compensation/?partner=rss&emc=rss

Today’s Economist: Uwe E. Reinhardt: What Hospitals Charge the Uninsured

DESCRIPTION

Uwe E. Reinhardt is an economics professor at Princeton. He has some financial interests in the health care field.

Steven Brill’s exposé on hospital pricing in Time magazine predictably provoked from the American Hospital Association a statement seeking to correct the impression left by Mr. Brill that the United States hospital industry is hugely profitable.

Today’s Economist

Perspectives from expert contributors.

In this regard, the association can cite not only its own regularly published data, but also data from the independent and authoritative Medicare Payment Advisory Commission, or Medpac, established by Congress to advise it on paying the providers of health care for treating Medicare patients.

As shown by Chart 6-19 of Medpac’s report from June 2012, “Health Care Spending and the Medicare Program,” the average profit margin (defined as net profit divided by total revenue) for the hospital industry over all is not extraordinarily high, although for a largely nonprofit sector I would rate it more than adequate.

Medicare Payment Advisory Commission

But in each year there is a large variance about that year’s average shown in Chart 6-19, with about 25 to 30 percent of hospitals reportedly operating in the red and many others earning margins below the averages.

The hospital association also correctly points out that under the pervasive price discrimination that is the hallmark of American health care, the profit margin a hospital earns is the product of a complicated financial juggling act among its mix of payers.

Payers with market muscle — for example, the federal Medicare and state Medicaid programs — can get away with paying prices below what it costs to treat patients (see, for example, Figure 3-5 and Table 3-4 in Chapter 3 of Medpac’s March 2012 report).

With few exceptions, private insurers tend to be relatively weak when bargaining with hospitals, so that hospitals can extract from them prices substantially in excess of the full cost of treating privately insured patients, with profit margins sometimes in excess of 20 percent.

Finally, uninsured patients — also called “self-pay” patients — have effectively no market power at all vis-à-vis hospitals, especially when they are seriously ill and in acute need of care. Therefore, in principle, they can be charged the highly inflated list prices in the hospitals’ chargemasters, an industry term for the large list of all charges for services and materials. These prices tend to be more than twice as high as those paid by private insurers.

To be sure, if uninsured patients are poor in income and assets, they usually are granted steep discounts off the list prices in the chargemaster. On the other hand, if uninsured patients are suspected of having good incomes and assets, then some hospitals bill them the full list prices in the chargemaster and hound them for these prices, often through bill collectors and even the courts.

It is noteworthy that in its critique of Mr. Brill’s work, the association statement is completely silent on this central issue of his report. A fair question one may ask leaders of the industry is this:

Even if one grants that American hospitals must juggle their financing in the midst of a sea of price discrimination, should uninsured, sick, middle-class Americans serve as the proper tax base from which to recoup the negative margins imposed on them by some payers, notably by public payers?

My answer is “No,” and I am proud to say that when luck put in my way an opportunity to act on that view, I did.

In the fall of 2007, Gov. Jon Corzine of New Jersey appointed me as chairman of his New Jersey Commission on Rationalizing Health Care Resources. On a ride to the airport at that time I learned that the driver and his family did not have health insurance. The driver’s 3-year-old boy had had pus coming out of a swollen eye the week before, and the bill for one test and the prescription of a cream at the emergency room of the local hospital came to more than $1,000.

By circuitous routes I managed to get that bill reduced to $80; but I did not leave it at that. As chairman of the commission, I put hospital pricing for the uninsured on the commission’s agenda.

After some deliberation, the commission recommended initially that the New Jersey government limit the maximum prices that hospitals can charge an uninsured state resident to what private insurers pay for the services in question. But because the price of any given service paid hospitals or doctors by a private insurer in New Jersey can vary by a factor of three or more across the state (see Chapter 6 of the commission’s final report), the commission eventually recommended as a more practical approach to peg the maximum allowable prices charged uninsured state residents to what Medicare pays (see Chapter 11 of the report).

Five months after the commission filed its final report, Governor Corzine introduced and New Jersey’s State Assembly passed Assembly Bill No. 2609. It limits the maximum allowable price that can be charged to uninsured New Jersey residents with incomes up to 500 percent of the federal poverty level to what Medicare pays plus 15 percent, terms the governor’s office had negotiated with New Jersey’s hospital industry.

I wouldn’t be surprised if the New Jersey hospital industry was cross at me and the commission for our role in the passage of Assembly Bill 2609. The commission took the view that it helped protect the industry’s image from some of its members’ worst instincts.

In that spirit, I invite the American Hospital Association to join me in urging federal lawmakers to pass a similar law for the nation. Evidently the mere guidelines on hospital pricing that the association published in 2004 have not been enough.

Indeed, in 2009 I had urged the designers of the Affordable Care Act to include such a provision in their bill — alas, to no avail. Courage to impose it on the industry had long been depleted.

Article source: http://economix.blogs.nytimes.com/2013/03/15/what-hospitals-charge-the-uninsured/?partner=rss&emc=rss

Today’s Economist: Reader Response: Medicare Options and Quality of Care

DESCRIPTION

Uwe E. Reinhardt is an economics professor at Princeton. He has some financial interests in the health care field.

My post last Friday explored the quality of care rendered Medicare beneficiaries under private Medicare Advantage plans and under the traditional, government-run Medicare program.

At the end of the post, I invited readers to apprise me of any study on the subject that my own search of the surprisingly thin literature on this issue might have missed.

Today’s Economist

Perspectives from expert contributors.

One reader was kind enough to alert me to such a paper, although he also had not come upon it by a general Internet search. It is a paper by Bernard Friedman, H. Joanna Jiang, Claudia A. Steiner and John Bott, titled “Likelihood of Hospital Readmission after First Discharge: Medicare Advantage vs. Fee-for-Service Patients” and published in the November 2012 issue of the health policy journal Inquiry.

The authors estimate the likelihood of a hospital readmission within 30 days of discharge from a 2006 database maintained by the Agency for Health Care Research and Quality. As I noted in my previous post, such readmissions have come to be known as one dimension of “quality,” with higher rates denoting lower quality.

Without adjusting their estimates for the age and health status of Medicare beneficiaries in the two options, the authors find a slightly lower likelihood of readmission under Medicare Advantage plans than under traditional Medicare. They note, however, that Medicare Advantage enrollees tend to be younger and less severely ill. After controlling for age and health status, enrollees in the Medicare Advantage plans are found to have “a substantially higher likelihood of readmission.”

The authors are well known and respected in the research community. Their approach is thoughtful and sophisticated and their findings persuasive. But they come to the opposite conclusion reached by the studies cited in my previous post.

So, to paraphrase Alexander Pope, who shall decide, when doctors (here, health services researchers) disagree, and soundest casuists doubt, like you and me?

The answer is that a single study of this sort is rarely conclusive, because it is extraordinarily difficult to tease the truth out of nonexperimental data — that is, data reported by operating entities for purposes other than the narrow purpose of a particular research study.

Medicare beneficiaries self-select into traditional Medicare or Medicare Advantage plans. They may differ systematically in characteristics that could indirectly affect readmission rates. Age and health status are two characteristics that can usually be measured and might be included in the available data set; but there may be others not included. Researchers try as best they can to make statistical adjustments for differences in the characteristics among self-selecting beneficiaries, as the authors of all of the studies cited in my previous post did. But the adequacy of these adjustments depends on the available data. Typically researchers acknowledge such limitation of their studies forthrightly in their reports.

A second point, perhaps not obvious to the uninitiated, is that a given data set can reveal different apparent “truths,” depending on the statistical methods used by researchers to tease out the truth. Dispassionate, objective researchers usually explore whether alternative statistical approaches would make a difference in their findings. On the other hand, researchers with an agenda can exploit this phenomenon to tease out of a data set the “truth” they may prefer. For that reason, scientific journals now go to great lengths to report researchers’ potential conflicts of interest, although the reported conflicts cannot and do not cover political ideology.

From which follows a third point, namely, that no one should ever take a single statistical study, or even a few, as a revelation of the truth. As I tell my students: “You can never trust a single statistical study in health policy. On the other hand, you can take the general thrust of many studies as in indication of what is likely to be true. And do check carefully who the authors are.”

All of which raises the overarching question: Given all these limitations of studies emerging from health services research, is it an effort worth the money spent on it?

First of all, the total sum the United States spends each year on health services research is trivial if compared to total annual health spending. If one plots it in a pie chart, health services research is not a visible slice but just a line. Probably no economic sector in the economy performs as little operations research as does health care – and it shows in the sector’s performance.

For the most part, health policy in this country is based on accepted folklore, forged from the legislator’s personal experience or information brought to him or her by acquaintances or lobbyists. One can view health services research of the sort cited in this and the previous post as a sincere attempt to limit the wide and often wild terrain over which the folklore on a particular policy issue would otherwise range.

It is illuminating to compare health services research with another effort to structure information for decision making: financial accounting. Modern economies spend a fortune on it. Throughout the year, the large accounting departments of enterprises assemble data for periodic reports on the financial condition and performance of the enterprise. External auditors are engaged to check the validity of these numbers. In the end, they usually attest that whatever is reported “fairly represents the financial condition of the XYZ Company, in accordance with generally accepted accounting principles.”

Yet, for all that effort and the money spent on it, does anyone believe that a company’s “statement of financial condition” (balance sheet) as of particular day of the year accurately summarizes its financial condition? For anyone who believes that, I would invite attention to the recent saga of Hewlett-Packard, not to mention the financial reports produced by investment banks in the past decade or so.

In fact, as someone thoroughly familiar with both financial accounting and health services research, I will offer this brash assertion: In terms of worrying over biases in their estimates and the overall sophistication and quality of their work, health services researchers tower over business accountants. Accountants cannot even state that their estimates are unbiased, because they do not even attempt to avoid bias in their estimates.

But that said, it also is surely true that the world is much better off with financial reporting, dubious as it sometimes can be. Would anyone want to rely merely on folklore to assess the performance of businesses?

Article source: http://economix.blogs.nytimes.com/2013/01/25/reader-response-medicare-options-and-quality-of-care/?partner=rss&emc=rss

Economix Blog: Uwe E. Reinhardt: Is U.S. Health Spending Finally Under Control?

DESCRIPTION

Uwe E. Reinhardt is an economics professor at Princeton. He has some financial interests in the health care field.

“Growth in U.S. health spending remains slow in 2010” was the headline of a news release on Jan. 9 by the Centers for Medicare and Medicaid Services, part of the Department of Health and Human Services. At an increase of 3.9 percent over national health spending in 2009, “the rates of health spending growth in 2009 and 2010 marked the lowest rate in the 51-year history of the National Health Expenditure Accounts,” the release said.

Today’s Economist

Perspectives from expert contributors.

The news was quickly picked up and disseminated by news organizations, including The New York Times.

What is one to make of this development? Is it evidence that we have finally “broken the back of the health care inflation monster,” as former Secretary of Health and Human Services Margaret Heckler famously put it in 1984. That was just after the Reagan administration had introduced the current prospective case-based payments for hospital inpatient care but two years before the health care inflation monster returned with a vengeance.

The charts below provide a longer-run perspective on health spending in the United States. They are all based on the rich data tables released annually by the Office of the Actuary of the Centers for Medicare and Medicare Services.

Charts 1 and 2 show the growth of health spending from 1965 to 2010, broken down by source of payment. Chart 1 exhibits the time path of actual health spending, not adjusted for inflation. Chart 2 exhibits the percentage of total national health spending contributed by the various sources in the chart.

In the charts the green area denotes out-of-pocket spending at the time health care is consumed, the red private health insurance, the gray Medicare, the yellow Medicaid and the blue “other third-party payments.”

The latter category is a grab bag of mainly public programs like spending by the Department of Defense, the Veterans Administration health system, the Indian Health Service, Workers’ Compensation, school health, general federal and state public-health activities and so on. Although each item in the list is relatively small, together these programs now add up to slightly over 20 percent of total national health spending.

Charts 1 and 2 illustrate the growing role of the Medicare and Medicaid programs in total health spending. They also show that out-of-pocket spending as a percentage of total national health spending has steadily decreased over time, even though the average American family probably feels that quite the opposite has occurred.

This is so because out-of-pocket spending for health care in dollars in the United States can rise even though as a percentage of total health spending it falls, because per-capita health spending in the United States is so large – typically twice as large as the corresponding figures in other nations.

Charts 3 and 4 tell an interesting story. The red line in Chart 3 represents inflation-adjusted, real national health spending per capita in constant 2005 dollars. The blue line represents real, inflation-adjusted gross domestic product per capita. The G.D.P. deflator was used to adjust the two-time series for inflation (see Table B-7).

As the charts show, both real national health spending per capita and real G.D.P. per capita fluctuate considerably from year to year. On average, the growth rate of health spending has exceeded the growth rate of G.D.P., although in a few years the opposite occurred.

I am certainly not the first to notice this. Charts like these are old hat in the Office of the Actuary of the Centers for Medicare and Medicaid Services, and they have been remarked on in the literature for some time, as this example shows.

Charts 3 and 4 illustrate two additional points.

First, depending on the beginning and end points one chooses for calculation, the average percentage points by which the annual growth in health spending has exceeded the average annual growth in G.D.P. over the chosen period – a difference known among health policy analysts simply as “excess cost growth” – can vary quite a bit. One really needs charts like these to study the phenomenon, not point-to-point averages.

Second, the annual growth in real health spending per capita appears to have fluctuated around a long-run trend that has declined ever so gently over the longer period (see the blue line in Chart 3). That trend reflects in part that the annual growth in real G.D.P. per capita has also fluctuated around a gently declining trend line. As is shown in Chart 4, the trend line around which excess growth fluctuates is virtually flat.

The $64,000 question is how soon the excess growth of health spending will descend from its historical average of 1.5 to 2.5 percent first to, say, 1 percent or so, and eventually to 0 percent.

It is tempting to view the relatively lower cost growth in recent years as a first step in that direction. But nothing in the history of health spending in the United States suggests that this is the time to break out the Champagne to celebrate that victory.

After all, low rates of spending increases in 2009-10 could just be the lagged effect of the deep recession in 2008-9. There is evidence in the literature that health spending does not completely march to its own drummer, regardless of what happens in the rest of the economy, but instead tends to rise and fall somewhat with the rest of the G.D.P., albeit with a lag of one to two years. The safest bet is that on the long road to eventual zero excess growth in health spending, we will ride up and down quite a few more times on the health-spending roller coaster.

Now why is it reasonable to assume that excess cost growth will just have to decline to zero in the long run – that is, to assume that health spending will not eventually growth faster than G.D.P. and perhaps even more slowly?

Economists would explain such a trend as flows: as the fraction of G.D.P. devoted to health care increases, the added satisfaction, or utility, that people derive from added health care is likely to diminish relative to the added satisfaction derived from consuming more of other things. It could explain a gradual decline in the excess growth of health care spending.

Finally, economists retreat here to the one law on which they all agree, namely, Stein’s Law, named for the late economist Herbert Stein: “If something cannot go on forever, it will stop.” Trust us. It will, in the long run.

Article source: http://feeds.nytimes.com/click.phdo?i=86df176d7c9fa50dc4a83e04d14374f3

Economix Blog: Uwe E. Reinhardt: Flow of Money From Households to Providers of Health Care

DESCRIPTION

Uwe E. Reinhardt is an economics professor at Princeton. He has some financial interests in the health care field.

My last post, “The Role of Prices in Health Care,” contained a chart connecting health spending with health income. One reader commented:

The graph misses a very major, and growing, component of the U.S. health care system. In between “the rest of society” and the “owners of health care resources” there is not only the “health care system” but also the United States government (unless we view the government as one of those resources). This is sapping a not insignificant portion of the resources that could and should otherwise be devoted to the provision of actual health care services.

Today’s Economist

Perspectives from expert contributors.

I am not sure just what to make of this. Is the argument that government is a sinkhole that absorbs “a not insignificant portion of the resources” that could otherwise be devoted to health care proper? Are there not other intermediaries, such as private insurers? Or is the argument that government as a public provider of health insurance to millions of Americans siphons off financial resources and returns no benefits to society, while private insurers do?

Consider the chart below. It illustrates that the flow of money through health care in the United States is complicated, with many detours on the way from households, which ultimately pay for all of the nation’s health care, to providers. Along the way are a number of pumping stations, employers among them.

Naturally, the providers of health care receive less than what households originally contributed to finance health care. Like private insurers, public insurers are pumping stations along the way that keep some of the money to finance their own operations. And both the public and private pumping stations provide society benefits in return, namely, access to health care when needed and the peace of mind that the family will not go broke over medical bills from a major illness.

Readers who seek to get a feel for the dollars flowing through this piping system — $2.6 trillion in 2010 — can find insight in Table 16 of the most recent National Health Expenditure Projections published by the Centers for Medicare and Medicaid Services of the Department of Health and Human Services (referred to hereafter as C.M.S. data).

This next chart conveys an idea of changes over time in the money flow through major public and private insurance programs and through out-of-pocket payments by patients. It should be noted that the fraction of Medicaid in this chart includes the federal match, which is about two-thirds of total Medicaid spending. It is a fact that government insurance programs have played an increasing role in the overall health care money flow. Their role in the future is now a fiercely debated issue in the political arena.

To get a rough indication of what fraction of the money flow is retained by the various pumping stations in the money flow, it is helpful to compare what the C.M.S. actuaries call National Health Expenditures, or N.H.E., with what they call Personal Health Care Expenditures, or P.H.C., a component. N.H.E. includes all outlays on health care, including research and construction. It also includes what the intermediate pumping stations (i.e., public and private health insurers) retain for their operations. P.H.C., on the other hand, represents only what the providers of health care received from the various intermediaries and directly from patients.

This next chart exhibits personal health spending as a percentage of total national health spending for three health insurers: private insurers, Medicare and Medicaid. These data are calculated from Tables 3 and 5 of the C.M.S. data. These percentages suggest that a relatively high share of the funds Congress and state legislators appropriate for the two largest government programs, Medicaid and Medicaid, becomes revenue for the providers of health care.

According to a C.M.S. actuary, for the traditional Medicare program excluding money contributed by Medicare to private Medicare Advantage plans on behalf of beneficiaries choosing those plans, as much as 98 cents is paid to providers for every $1 appropriated by Congress for Medicare. (The 93.8 percent shown in the next chart includes Medicare dollars channeled through Medicare Advantage plans.)

In fairness, it must be added that traditional Medicare basically sets prices and then just pays bills. It makes no active attempt to manage care (utilization controls, disease management, coordinating care and so on), because it has not been allowed by Congress to do so. It is almost as if Congress did not want traditional Medicare to be a prudent purchaser of heath care for the elderly.

From the viewpoint of prudent purchasing, most economists would probably judge these prices too low. On the other hand, the fact that traditional Medicare just pays bills more or less passively may be precisely the reason that it is still so popular among the elderly. Traditional Medicare still offers beneficiaries completely free choice of providers and therapy — a degree of freedom that many younger Americans in insurance plans with limited networks of providers no longer enjoy.

The ratio of P.H.C. to N.H.E. for private insurance reflects what is known as the medical loss ratio, or M.L.R., on which I have written a post previously. It is the fraction of the premium an insurer pays out for “health benefits.” The overall average of 88.3 percent for private insurance includes M.L.R.’s ranging all the way from a low 55 percent for small insurers selling policies to individuals and small employers, mainly through insurance brokers, to M.L.R.’s above 90 percent for large insurers performing merely administrative services (e.g., negotiating fees or claims processing) for self-insuring large employers.

The ratios in the last chart should not be confused with the overall administrative overhead of health care in the United States, a topic already touched on in an earlier post. A public or private health insurance program not only has its own operating costs but visits substantial administrative costs on the providers of health care, mainly on billing properly for services rendered.

I shall comment on these additional overhead costs in a future post.

Article source: http://feeds.nytimes.com/click.phdo?i=8d9f2c092dc61e27ceedc4d516123768

Economix: The Human-Capital Approach to Occupational Choice

Today's Economist

Uwe E. Reinhardt is an economics professor at Princeton. He has some financial interests in the health care field.

My previous post, on the shortage of primary-care doctors, brought forth a set of illuminating comments. As many readers pointed out correctly, the issue has many facets, not only an economic one.

Although economists are fully aware of the complexity of career choices, in their Op-Ed piece on the subject that inspired my initial post, Drs. Peter Bach and Robert Kocher used what economists call the human-capital approach to occupational choice.

That approach styles a career choice as an ordinary investment project, focused mainly on alternative cash flows or, in their more sophisticated forms, monetary equivalents of costs and benefits. Drs. Bach and Kocher focus purely on cash flows.

To recap their proposal, they would make attending medical school free of tuition for all students and pay that substantial cost by eliminating the salaries currently paid to residents not in a primary-care residency.

Making tuition free will not increase the overall number of medical school graduates –- because their number is constrained by the limited supply of medical-school places in the United States.

There is already huge excess demand for medical education in the United States, which denies access to thousands of qualified American college graduates every year, then covers the resulting physician shortage by importing large numbers of medical graduates from abroad.

Drs. Bach and Kocher believe that eliminating the salaries of residents in the specialties will drive many among an artificially limited supply of medical school graduates into primary care. Frankly, I doubt it.

To follow my reasoning, let us build the human-capital model that economists would use in the classroom to this end.

The Baseline Human-Capital Model
To illustrate the human-capital approach, I begin with what I shall call the baseline case, using numbers from Drs. Bach and Kocher. Currently, residents in both primary care and in a non-primary-care specialty (hereafter just “specialty”) are paid salaries starting at $50,000 and assumed here to be rising at an annual rate of 3 percent.

We imagine a 26-year-old medical-school graduate who is choosing between a career in primary care and a higher-paying medical specialty that does, however, require two added years of residency. We assume that primary-care physicians serve a three-year residency and residents in the non-primary specialty serve a five-year residency.

Upon completion of their residencies, we assume that primary-care physicians will start practice at a pretax income of $190,000 and specialty physicians will earn 70 percent more in every year of their career, as suggested by Drs. Bach and Kocher. Thus, we assume that specialists start at an annual income of $323,000. Our assumption, as noted, is that specialists start practice two years later than primary-care physicians.

Finally, we assume that the incomes of both categories of physicians grow at 5 percent a year until age 55 and a bit more slowly thereafter. That rate may be higher than current growth rates in annual physician incomes; the higher rate reflects an impending overall shortage of physicians in the United States, as is now widely anticipated by the experts. In fact, a rate of 5 percent may turn out to be low.

Many physicians may not recognize their own experience in this hypothetical example, because there is considerable variance among physician incomes. I merely seek to be illustrative here with reasonably realistic central tendencies.

The chart below illustrates the alternative future cash flows that our hypothetical baseline case implies over the physicians’ careers, starting with their first year of residency. For ease of calculation, we make the assumption that all salaries and incomes are received by the physician at the end of the year in one lump sum.

The red line in the chart represents our hypothetical primary-care physicians and the blue line the specialist.

Let us now look at the purely financial investment implied by a medical-school graduate’s decision to train for a specialty rather than pursue a primary-care career, other things being equal.

Basically, the investment here is the primary-care income that the specialists forgo during the extra two years of residency, minus the residency salary they will earn in those two years. The return on that investment is the much higher income the specialist earns thereafter.

The next chart depicts the differential cash flow implied by this investment decision. From a monetary perspective, training for a specialty tends to bring a large payoff on a relatively small investment outlay, certainly for the higher-paying specialties.

The two most widely used metrics in the classroom and in modern business practice to evaluate future cash flows from investments are the net present value of the cash flow, known as N.P.V., and the internal rate of return on the decision, known as I.R.R.

(This is not the place to explain these two economic concepts in detail. For readers who would like to know a bit more about them, see the lecture notes from my freshman economics course.)

In a nutshell, the net present value of an investment is the algebraic sum of the future periodic cash flows it yields, with each future year’s cash flow converted to present-value terms. In this case “present” means the beginning of the first year of residency.

The idea is that if one can earn, say, 6 percent on $1,000 invested for one year, one would end up with $1,060 at the end of the year. The $1,000 is thus the present value of the $1,060 receivable one year hence. By the same reasoning, at an interest rate (also called discount rate) of 6 percent, a $350,000 receivable, say, 12 years hence would have a present value of only $173,939 = $350,000/(1.06)12.

Practically, we can think of the N.P.V. as the amount by which the investor’s (here the specialist’s) wealth is expected to increase, as of the moment when the investment decision is made, by choosing the investment rather than forgoing it. Think of it as instant wealth creation, but wealth measured in N.P.V. terms.

The I.R.R. is a more difficult concept. It can be thought of as the rate of return the investment project yields, in any given year, on the amount invested in the project and not yet returned by past cash inflows as of the beginning of that year.

In their textbooks on corporate finance, economists regularly warn against relying on the I.R.R. to evaluate investment decisions, because that metric can be quite treacherous. Ironically, when applying the human-capital model to occupational choice in their theoretical or empirical work, economists have focused mainly on the I.R.R.

In what follows, I shall focus mainly on the N.P.V. criterion.

For our baseline case — in the absence of the Bach-Kocher proposal — where both types of physicians are paid salaries during their residencies, the net present value of an investment in becoming a specialist rather than a primary-care physician, calculated at an annual discount rate of 6 percent, is $2.1 million. (If we had looked just as the algebraic, undiscounted sum of the differential cash flow in the second chart it would be $9.3 million, but because $1 received 40 years hence is not the same as $1 received one year from now, the algebraic sum of long-term future cash flows has no useful meaning).

I note in passing that the corresponding I.R.R. to this investment is 39.22 percent. That rate of return may strike readers as very high, but even higher rates have been found in the empirical literature (see, for example, Pages 4-8 in this paper by Sean Nicholson, now of Cornell University, and Slide 18 in another of his papers).

The Bach-Kocher Proposal
Under this proposal, no medical student would pay tuition. Therefore we can disregard tuition altogether, because there is no difference between the two types of physicians.

In fact, the only small difference between this proposal and the current baseline is that specialty residents would not be paid a salary during their five years of residency. The algebraic sum of the foregone salaries is a mere $265,457. Its present value is $222,872, not even as much as the specialist’s first-year income. It represents a decline of about 3.3 percent in the $6.8 million N.P.V. of the specialist’s lifetime cash flow.

Put another way, the Bach-Kocher proposal would shrink the difference between the N.P.V.’s of the two physicians’ lifetime earnings to about $1.88 million, from $2.1 million.

If I were the medical school graduate and had to choose between a specialty career or a primary-care career, these small declines in the N.P.V. of my expected lifetime earnings certainly would not drive me into primary care.

An Alternative Proposal
An alternative proposal would be not to force specialists to forgo their residency salaries. Instead, we would alter the baseline case simply by raising the primary-care physician’s income by X percent in each year of practice, leaving the cash flow of specialists unchanged. In that case, one would not make medical school tuition-free, sparing the taxpayer the need to bear that cost.

For starters, let us ask how large X would have to be to achieve the same result as the Bach-Kocher proposal, in terms of a decline of the N.P.V. of the specialist’s cash flow relative to the primary-care physician’s.

The answer is that a 2.21 percent increase in every year of the primary-care physician’s income would have the same overall effect as withholding the salaries of the specialists during residency. That may seem a small increase, but it would, of course, be applied every year, and that will add up.

While the Bach-Kocher proposal is imaginary and novel, I conclude that is too timid to move the mountain.

If there really is a shortage of primary-care physicians in America — and one could have a debate on that issue — then more powerful policy tools must come into play, going beyond mere financial return, which is but one of many factors driving specialty choice.

Part of a better policy solution would be to inquire more deeply how medical graduates responds to income differentials in practice. Do they use the concepts taught in economics? Or do they just observe prevailing income differentials among the various specialties and base their choices on that information?”

Article source: http://feeds.nytimes.com/click.phdo?i=958a2f59ad666b34724d9ae965beb524