March 29, 2024

Economix Blog: Women’s Unemployment Surpasses Men’s

CATHERINE RAMPELL

CATHERINE RAMPELL

Dollars to doughnuts.

For the first time in more than six years, the unemployment rate for adult women (those over age 20), seasonally adjusted, has surpassed that for adult men.

Women's unemployment rate is in blue, men's in red. Data are seasonally adjusted.
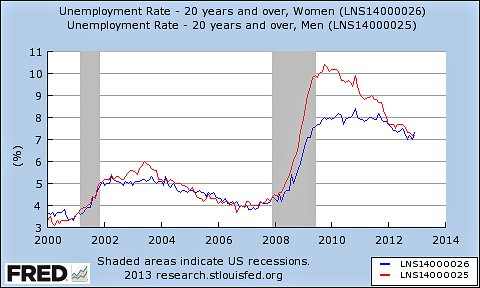
Federal Reserve Bank of St. Louis Women’s unemployment rate is in blue, men’s in red. Data are seasonally adjusted.

This reversal was first noted by Joan Entmacher, vice president for family economic security at the National Women’s Law Center.

During the recession, men had borne the brunt of job losses, which were disproportionately in male-dominated industries like construction and manufacturing. Over the course of the recovery that began in mid-2009, however, these sectors have improved a little, while the female-dominated public sector has been shedding workers.

As you can see in the chart above, the unemployment rate for adult men (red line) has fallen sharply since early 2010. That trend is due in part to stronger hiring of men, but also to a more discouraging development: men are dropping out of the labor force in very high numbers.

The unemployment rate for adult women (blue line) never got nearly as high as that for men, but then it has not fallen by much either. Like men, women were leaving the labor force in droves from 2009 to 2011. Women’s participation rates appeared to stabilize somewhat last year.

I should note, by the way, that the unemployment rate for male teenagers is still much higher than that of females: 25.9 percent compared with 21.2 percent.

Article source: http://economix.blogs.nytimes.com/2013/01/04/womens-unemployment-surpasses-mens/?partner=rss&emc=rss

Many Low-Wage Jobs Seen as Failing to Meet Basic Needs

The Labor Department will release its monthly snapshot of the job market on Friday, and economists expect it to show that the nation’s employers added about 190,000 jobs in March. With an unemployment rate that has been stubbornly stuck near 9 percent, those workers could be considered lucky.

But many of the jobs being added in retail, hospitality and home health care, to name a few categories, are unlikely to pay enough for workers to cover the cost of fundamentals like housing, utilities, food, health care, transportation and, in the case of working parents, child care.

A separate report being released Friday tries to go beyond traditional measurements like the poverty line and minimum wage to show what people need to earn to achieve a basic standard of living.

The study, commissioned by Wider Opportunities for Women, a nonprofit group, builds on an analysis the group and some state and local partners have been conducting since 1995 on how much income it takes to meet basic needs without relying on public subsidies. The new study aims to set thresholds for economic stability rather than mere survival, and takes into account saving for retirement and emergencies.

“We wanted to recognize that there was a cumulative impact that would affect one’s lifelong economic security,” said Joan A. Kuriansky, executive director of Wider Opportunities, whose report is called “The Basic Economic Security Tables for the United States.” “And we’ve all seen how often we have emergencies that we are unprepared for,” she said, especially during the recession. Layoffs or other health crises “can definitely begin to draw us into poverty.”

According to the report, a single worker needs an income of $30,012 a year — or just above $14 an hour — to cover basic expenses and save for retirement and emergencies. That is close to three times the 2010 national poverty level of $10,830 for a single person, and nearly twice the federal minimum wage of $7.25 an hour.

A single worker with two young children needs an annual income of $57,756, or just over $27 an hour, to attain economic stability, and a family with two working parents and two young children needs to earn $67,920 a year, or about $16 an hour per worker.

That compares with the national poverty level of $22,050 for a family of four. The most recent data from the Census Bureau found that 14.3 percent of Americans were living below the poverty line in 2009.

Wider Opportunities and its consulting partners saw a need for an index that would indicate how much families need to earn if, for example, they want to save for their children’s college education or for a down payment on a home.

“It’s an index that asks how can a family have a little grasp at the middle class,” said Michael Sherraden, director of the Center for Social Development at Washington University in St. Louis, who consulted on the project and helped develop projections for how much income families need to devote to savings. “If we’re interested in families being able to be stable and not have their lives disrupted and have a little protection and backup and be able to educate their children, then this is the way we have to think.”

The numbers will not come as a surprise to working families who are struggling. Tara, a medical biller who declined to give her last name, said that she earns $15 an hour, while her husband, who works in building maintenance, makes $11.50 an hour. The couple, who live in Jamaica, Queens, have three sons, aged 9, 8 and 6.

“We tried to cut back on a lot of things,” she said. But the couple has been unable to make ends meet on their wages, and visit the River Fund food pantry in Richmond Hill every Saturday. With no money for savings, “I’m hoping that I will hit the lotto soon,” she said.

To develop its income assessments, the report’s authors examined government and other publicly available data to determine basic costs of living. For housing, which along with utilities is usually a family’s largest expense, the authors came up with “a decent standard of shelter which is accessible to those with limited income” by averaging data from the Department of Housing and Urban Development that identified a monthly cost equivalent for rent at the fortieth percentile among all rents paid in each metropolitan area across the country.

They chose a “low cost” food plan from the nutritional guidelines of the Department of Agriculture, and calculated commuting costs “assuming the ownership of a small sedan.” For health care, they calculated expenses for workers both with and without employer-based benefits.

Ms. Kuriansky said that the income projections do not take into account frills like gifts or meals out. “It’s a very bare-bones budget,” she said.

Obviously, the income needs change drastically depending on where a family lives. Ms. Kuriansky said the group was working on developing data for states and metropolitan areas.

Article source: http://feeds.nytimes.com/click.phdo?i=a6388d52da53764fe96e8d20199166cc