November 23, 2024

Economix Blog: The Hard Math on Fossil Fuels

How close is the world to devastating climate upheaval? My column on Wednesday argued that the natural gas boom is helping the United States reduce its emissions of heat-trapping carbon into the air, encouraging power generators to switch to gas from the much dirtier coal. American CO2 emissions last year totaled about 5.25 billion tons — almost 13 percent less than in 2007.

But as some readers argued, the decline is so modest that it is almost irrelevant. To stop the world’s temperature from rising more than 2 degrees Celsius (3.6 degrees Fahrenheit) above the pre-industrial era — considered by most climate scientists as the prudent limit — emissions must fall much faster.

In fact, keeping to the target probably requires that a good share of the world’s fossil fuel remains untapped.
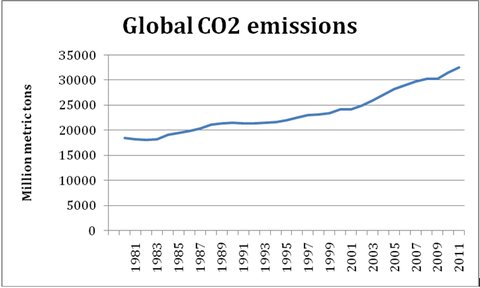
Source: Energy Information Administration, Department of Energy

Fatih Birol, chief economist of the International Energy Agency, told me the atmosphere could absorb at most another one trillion tons of CO2. It got almost 32 billion tons in 2011 alone, 3.2 percent more than the year before.

Even if emissions were to remain at the same level as last year — a highly unlikely prospect given the rapid growth of energy consumption in countries like China — the global economy, in about 30 years, would have to stop relying on fossil fuels entirely.

Most of the carbon in the ground is in the form of coal. But the world’s known reserves of oil and gas contain about one trillion tons of CO2. Applying Mr. Birol’s limit would require Saudi Arabia, Gazprom and Exxon to leave some of their reserves in the ground. They are unlikely to take kindly to this.

What’s more, Mr. Birol’s numbers may be too optimistic. Estimates by the Potsdam Institute for Climate Impact Research in Germany — reported by the Carbon Tracker Initiative in Britain — suggest that to keep the odds of exceeding the 2-degree ceiling below 20 percent, no more than 565 billion tons of CO2 can be put into the air over the next 40 years. That would require cutting the world’s total emissions by more than half, to about 14 tons a year.

Look at it this way: the world’s carbon intensity — the amount of carbon emitted into the atmosphere for each dollar of economic production — fell about 0.8 percent a year over the last decade or so. According to a study by PricewaterhouseCoopers, avoiding a 2-degree rise requires a decline in emissions of 5.1 percent a year — every year until 2050.

As the PricewaterhouseCoopers study suggests, it might be “too late for 2 degrees.”

Article source: http://economix.blogs.nytimes.com/2013/03/21/the-hard-math-on-fossil-fuels/?partner=rss&emc=rss

Scientists Say Atlas Is Wrong on Greenland’s Glaciers

Not the way climate scientists see it.

“Fiasco” was the word chosen by one scientist in an e-mail to the National Snow and Ice Data Center in Boulder, Colo., alerting his colleagues to erroneous claims made by the publishers of the atlas (whose name derives from The Times of London) about the speed at which Greenland’s glaciers are melting.

He also feared that a map in the atlas, along with news accounts repeating an error in the news release, could pull climate scientists into another vortex of damaging controversy.

The news release, echoed by the news media, claimed that Greenland had lost 15 percent of its permanent ice cover from 1999 to 2011. That translates to 125,000 cubic miles, according to a rough calculation by Etienne Berthier, a glaciologist with the University of Toulouse, enough melted ice to raise sea levels three to five feet.

The corresponding map in the atlas itself indicated that significant portions of Greenland’s coastline had become ice-free.

Glaciologists, previously bruised by an exaggerated claim about the melting of Himalayan glaciers in a 2007 United Nations report that became fodder for global warming skeptics, mobilized as a truth squad.

On blogs, on radio programs and in newspaper columns, they stated emphatically that Greenland has not lost 15 percent of its ice cover in recent years. The retreat, they said, is more like one-tenth of 1 percent. They were quick to add that nobody at the atlas had consulted them.

“It was a case where, really, the community came together really fast with both barrels blazing,” said Mark Serreze, director of the snow and ice center in Colorado. “Everyone had some real bad memories of this whole fiasco that had to do with Himalayan glaciers. No one wanted to see that again.”

The glaciers error in the 2007 report by the Intergovernmental Panel on Climate Change on Climate Change, although just a footnote, led to a torrent of criticism focused on climate scientists after it was identified early in 2010.

The HarperCollins subsidiary Collins Geo, publisher of the Times atlas’s 13th edition, has apologized for the news release and says it is “urgently reviewing” the map of Greenland. But for critics, its backtracking was a little slow — comparable, perhaps, to the actual rate at which Greenland’s ice is melting.

The news release and the atlas went public just after midnight on Sept. 15, a Thursday. Throughout the weekend, scientists were energetically challenging the error and trying to get their own information out.

By Monday, ScienceInsider, an online supplement to Science magazine, was reporting on the “outraged” scientists’ efforts. HarperCollins fired back at the scientists in a statement that was quoted that day in the newspaper The Guardian.

“We are the best there is,” an unidentified Harper Collins spokeswoman said. “We are confident of the data we have used and of the cartography.”

“We use data supplied by the U.S. Snow and Ice Data Center in Boulder, Colo.,” she went on. “Our data shows that it has reduced by 15 percent. That’s categorical.”

Theodore Scambos, a glaciologist at the center, set out to reverse-engineer the error. His best guess, after a foray into cartographic forensics, was that a mapmaker at the atlas had mistaken a center’s map of the ice’s thickness for one showing its extent.

In an e-mail on Friday, however, Sheena Barclay, the managing director of Collins Geo, said that was not what happened. But she did not say how the confusion arose.

The map of Greenland in the new edition shows significant portions of coastline in colors indicating land, as opposed to the white that denotes ice. “They’ve basically erased hundreds and hundreds of glaciers around Greenland,” said Poul Christoffersen, a glaciologist at the Scott Polar Research Institute in Cambridge, England, who praised the truth-squad effort. “It looks like the ice sheet is 100 kilometers,” or roughly 60 miles, “from the coast, whereas several glaciers are terminating right into the sea.”

On Thursday, Ms. Barclay said on a BBC radio news program that the Greenland map in the atlas would be reconfigured with the help of scientists, although she did not say the current one was wrong. She promised a new, “much more detailed map of Greenland that will represent more effectively the ice cover as it is.”

Asked if by “effectively” she meant “accurately,” Ms. Barclay replied, “It’s a case of actually how you define the ice itself, and at the scales at which we show Greenland it’s actually quite difficult to achieve that.”

Article source: http://feeds.nytimes.com/click.phdo?i=de5a038b40923abe44b07fa72dc99e0f