Staying Alive
The struggles of a business trying to survive.
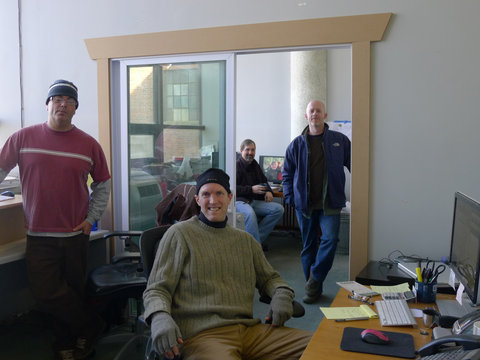
 Courtesy of Paul Downs Cabinetmakers.
My company has 14 employees. In the office we have me, two sales engineers, one design engineer, a part-time bookkeeper and a part-time administrative assistant. The other nine are out on the shop floor. They build, finish, and ship our product.
Our office is much like any office: people manipulating ideas about stuff, and moving money around. The factory, however, is set up to make a very particular product. The equipment, the arrangement, the skills of the people are all aimed at making wood conference tables. I have found, after 26 years of messing around with various forms of woodworking, that conference tables can support a business better than anything else I have tried. So that’s what we do. We can, when we want to, make other things. Some of our clients want us to build them credenzas or reception desks, and we do.
You might wonder, since this is about our production (Wednesday’s post, part of a five-part series, was about sales), how many tables we made in 2011. The answer: I don’t know, and I haven’t bothered to find out. I could spend some time in our database and come up with a number, but it wouldn’t mean much. Dividing our output into the unit “tables” doesn’t make much sense, because the tables we make vary so widely in size and complexity. This and this and this are each one table.
Instead, we take each sales contract that we write and break it into one or more work orders, each associated with a piece of furniture or, in the case of modular tables, with a set of identical objects. Each work order has been assigned a price by the sales team. That number is generated by estimating the number of hours required to design, build, finish, and ship the product, along with a tally of the materials we are likely to use and their costs. We use custom Excel spreadsheets to do this. These were complicated to write, but they have the virtue of allowing for quick and easy pricing of variations on our designs. (I explained more about this system in a previous post.)
Every day, our workers keep track of the hours they spend on each work order. They do this any way they feel like it — I presume that they take notes with pencil and paper as they go along. I don’t know how accurate they are. I have explained to them many times that accuracy is important, because that is the only way we can determine whether our pricing spreadsheets are kicking out reasonable estimates. They are smart guys, and I believe they do their best.
Anyway, at the end of each day, they enter the hours they spent on each job into our database. This is easy to do, and just takes a couple of minutes. The database has a report that compares the estimated hours with the hours actually used for every job in the system. All employees have access to this data, and I know that many of them keep careful track of whether they are under or over the estimate.
In 2011 our estimates suggested that it would take 14,618 hours to complete the projects that we built. The actual hours reported by the workers were 14,588. That’s a difference of .2 percent, which is pretty good! In aggregate, over a year, that is. In reality there is wide variation on particular jobs.
There were 163 work orders, but only seven of them came within 1 percent of the estimate. The others were all over the place. It appears that there are three reasons for the variation:
1) Estimates for complex work and new designs can be wrong. These are errors by the sales guys.
2) Problems on the shop floor. Machine malfunctions and mistakes happen — an odd thing I have noticed over the years is that they tend to cluster on one job. There are certain projects that just go straight downhill, with difficulty at every step. I don’t know why this is.
3) The spreadsheet models are designed to kick out a few more hours than a project that goes smoothly should require. So when we look at the individual jobs we see some over, some under, some way over, some way under — but adding up, for 2011, to almost perfect agreement between the model and reality.
One set of stats that I wish I had right now is a time series showing our aggregate over/under for the estimates, recording how we were doing at the end of each week, or month, would be useful. (I will be tracking that this year). I do check this now and then, and my recollection is that at the end of the first quarter we were over by about 10 percent, by the end of the second quarter we were over by 7 percent, and by the end of the third quarter we were over by 3 percent. We had a great fourth quarter, which brought the difference close to zero. So far this year, we are about 15 percent under our estimates.
I do have numbers on the value of tables built each month in 2011. When divided by the number of work days each month, we see an encouraging trend. In the first quarter of 2011 we were building at a rate of $6,537 a day. Second quarter: $7,833. Third quarter: $8,199. In the last quarter we got to $9,862 a day. I hired one worker for the shop floor last year, an additional finisher who came on board in April. But that doesn’t account for a 50.8 percent increase in productivity.
That outstanding result came, I believe, from three factors: mastering a number of new machines and processes that had been giving us difficulty in 2010; instituting error reviews as a regular part of our Monday meetings, so that everyone knows how particular technical issues should be solved; and teaching all of the workers to use the database, so that they could see in real time whether they were ahead or behind on estimates.
A 50-percent increase in productivity is, when you think about it, a staggering achievement. But keep in mind that one of the factors in the result, the dollars associated with each project, is controlled by the sales people. If they get more money for a table, the productivity as measured by dollars/day will go up even if build operations are unchanged. But we did not raise our prices by 50 percent. I did change the estimate model to include an extra 2 percent for sales commissions in July, and that’s all. I conclude that the boost in shop-floor productivity is real. This bodes well for 2012. In the last quarter of 2011 we had few of the equipment and process problems we saw at the beginning of the year.
In 2012, I’d like to see our output increase to $2.4 million, which would be a little more than 10 percent over 2011. And I’d like to do it without hiring anyone, because the training period for these positions is long and the cost of new workers is high. That means another productivity increase will be required. The sales guys are going to have to either make more sales, or get more money for each sale. Getting more money can be tricky, but there is one surefire way for us to sell more tables: do deals with people who need something in a hurry.
The clients who currently place orders are willing to wait six weeks or more for their orders to be delivered. We also get calls every week from people who have to have their table in three or four weeks and would happily pay our rates. For them, time is the deal buster. We are turning these people down right now, because I don’t care to lie about when tables will show up. But if we can find a way to decrease our backlog, or at least shoehorn in a couple of extra jobs now and then, we can get that 10 percent without any further investment on my part.
It’s mostly an information problem — we’ll need to know exactly how long it will take to complete our current order book and exactly when we need to ship to see if there is any excess time. Further increases in shop-floor productivity would go a long way to creating the capacity we need to do this.
Paul Downs founded Paul Downs Cabinetmakers in 1986. It is based outside of Philadelphia.
Article source: http://feeds.nytimes.com/click.phdo?i=30da3a1674a2c02a3deff5fdd4caf6d4