Carl Richards is a certified financial planner in Park City, Utah, and is the director of investor education at The BAM Alliance. His book, “The Behavior Gap,” was published this year. His sketches are archived on the Bucks blog.
A few weeks ago, I stumbled on some research by David J. Leinweber at Caltech. Apparently, he’s figured out how to predict the stock market using just three variables:
1) Butter production in the United States and Bangladesh
2) Sheep populations in the United States and Bangladesh
3) Cheese production in the United States
Statistically speaking, those three variables predicted 99 percent of the stock market’s movement. Imagine what you’ll be able to do with that information.
There’s only one problem. The joke is on us.
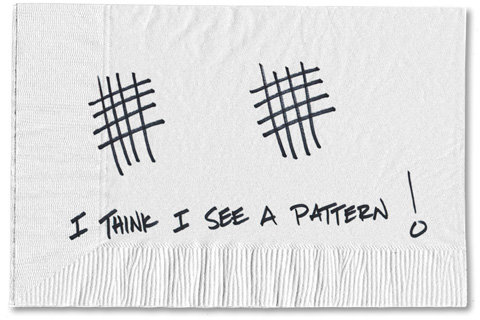
In our very human pursuit of looking for patterns, we start seeing things that aren’t really there. And as Dr. Leinweber highlighted in his study, we will mine the data until we see what we think is a pattern. We think if something happened a certain way in the past, then surely it will continue into the future. We start to believe, we want to believe, that this pattern will have predictive value.
Consider what’s going on in the stock market. The bubble watchers are convinced that they’ve identified a pattern from the past that tells us something about the future. And they even have charts and numbers to back up their pattern.
One of my current favorites compares the Nasdaq in 1999 and 2000 to the Standard Poor’s 500 Index in 2013. When you overlay the charts, they match perfectly. Imagine that. So, of course, we must be headed to an 80 percent decline. If you look a little closer, however, you’ll see the scales aren’t quite right. But it makes a fantastic visual if you’re looking for a pattern.
Then there’s the S.P. 500 itself. It is up 16.9 percent year-to-date. That’s the fastest start for the S.P. 500 since 1987, when it rose 18.7 percent during the same time period. But later that year, we had Black Monday, when the Dow dropped more than 22 percent in one day. So we should be looking for the same thing to happen in 2013, right?
In fact the S.P. 500 is full of patterns if you’re looking for them. Pick your poison: sheep, the S.P. 500, gross domestic product, or the latest unemployment numbers. If you look for some sort of theme to emerge, it’s highly likely you will see something. But the past is not prologue.
While some of these silly data mining tricks might be interesting to talk about, they won’t help you. Every time someone approaches me with research — and it’s always called research — that shows a pattern in the data, the pattern eventually goes away. These things always work perfectly, until they don’t.
Oddly enough, the only pattern that will influence your investing success is your behavior. Can you break the pattern of buying high and selling low? Can you break the pattern of chasing after the next “big” investment? And perhaps most importantly, can you buy low-cost investments in a diversified portfolio, and then ignore it?
Now that’s a pattern I can endorse.
Article source: http://bucks.blogs.nytimes.com/2013/05/28/the-only-investing-pattern-that-matters-is-behavioral/?partner=rss&emc=rss
Speak Your Mind
You must be logged in to post a comment.