December 20, 2024

Household Incomes Remain Flat Despite Improving Economy

“The poverty and income numbers are a metaphor for the entire economy,” said Ron Haskins of the Brookings Institution. “Everything’s on hold, but at a bad level.”

Over a longer perspective, the figures reveal that the income of the median American household today, adjusted for inflation, is no higher than it was for the equivalent household in the late 1980s.

For all but the most highly educated and affluent Americans, incomes have stagnated, or worse, for more than a decade. The census report found that median household income, adjusted for inflation, was $51,017 in 2012, down about 9 percent from an inflation-adjusted peak of $56,080 in 1999, mostly as a result of the longest and most damaging recession since the Depression. Most people have had no gains since the economy hit bottom in 2009.

The government’s authoritative annual report on incomes, poverty and health insurance, released Tuesday, underscores that the economic recovery has largely failed to reach the poor and the middle class, even as the unemployment rate continues to sink and growth has returned.

Government programs remain a lifeline for millions. Unemployment insurance, whose eligibility the federal government expanded in response to the downturn, kept 1.7 million people out of poverty last year. Food stamps, if counted as income, would have kept out four million.

Since the recession ended in 2009, income gains have accrued almost entirely to the top earners, the Census Bureau found. The top 5 percent of earners — households making more than about $191,000 a year — have recovered their losses and earned about as much in 2012 as they did before the recession. But those in the bottom 80 percent of the income distribution are generally making considerably less than they had been, hit by high rates of unemployment and nonexistent wage growth.

Moreover, economists believe that the report understates the degree of income inequality in the United States, by not including, among other things, earnings from capital gains made on rising stock prices.

In one glimmer of improvement, the number of men working full time year-round with earnings increased by one million from 2011 to 2012, to a total of 59 million. Still, the labor market continues to look weak, in particular for less-educated and lower-income men. The labor force participation rate of men has fallen steadily for the past 60 years. In no small part, that is because the median earnings of men working full time have not increased in real terms since the early 1970s.

For women, the earnings stall started about a decade ago, when the gender pay gap stopped closing. “The wage gap hasn’t budged a penny,” said Fatima Goss Graves of the National Women’s Law Center. “After 11 years of no progress on equal pay, policy makers need to get moving to improve the country’s pay discrimination laws, raise the minimum wage and remove the barriers women face in higher-wage jobs.”

The West was the only region that experienced a statistically significant increase in median income, the Census Bureau said, while all other regions were flat. That most likely reflects the relatively strong growth in Washington, Oregon, California and Utah last year. North Dakota, experiencing an oil and gas boom, is the fastest-growing state, though its population is so small that it barely affects the national statistics.

No racial or ethnic group experienced significant changes in income, but that left the gap between Asians, at the top, and blacks, at the bottom, as wide as before. The median income for Asian households was $68,600. For non-Hispanic whites, it was about $57,000, while the typical Hispanic household had an income of $39,000, and blacks were at $33,300.

Article source: http://www.nytimes.com/2013/09/18/us/median-income-and-poverty-rate-hold-steady-census-bureau-finds.html?partner=rss&emc=rss

United States’ 2nd-Quarter Growth Is Revised Up to 2.5%, From 1.7%

Gross domestic product, a broad measure of goods and services produced across the economy, grew in the second quarter at an annualized rate of 2.5 percent in April through June of this year, the Commerce Department reported on Thursday. The government initially estimated G.D.P. at 1.7 percent.

The growth rate is still far lower than what the country needs to recover the ground lost during the recent recession anytime soon. The long-term average growth rate for the economy is more than 3 percent, and the economy needs above-trend growth to make up for sharp losses from the downturn.

Even so, the upward revision was welcome news, particularly alongside another report on Thursday showing that jobless claims were falling. The improving economy is also likely to factor into the Federal Reserve’s decision to pull back from its stimulus efforts, which some analysts expect as soon as September.

Expansion in the second quarter — faster than the annualized growth rate in the first quarter of 1.1 percent — was driven by gains in consumer spending, exports, private inventory investment, nonresidential fixed investment and residential fixed investment. Residential fixed investment, which reflects the sharp rebound in housing construction, has been one of the brightest spots in the economy so far this year, growing at an annualized rate of 12.9 percent in the second quarter and 12.5 percent in the first.

The shrinking government continues to drag on the economy. State and local government spending has declined almost every quarter for the last four years, and federal government spending fell during about half of those quarters. The upward revision to gross domestic product last quarter primarily reflected the fact that exports turned out to be higher than initially estimated and imports were actually slightly lower.

“The good news is that the economy accelerated in the second quarter to a degree that was even better than expected,” said James M. Baird, chief investment officer for Plante Moran Financial Advisors. “However, it’s also clear that wary consumers and businesses haven’t fully bought in to an imminent return to more robust growth and will not go ‘all in’ on spending and investment.”

The revisions seemed to further convince economists that the Federal Reserve will begin tapering its large-scale asset purchases at its September meeting. The Fed chairman, Ben S. Bernanke, has said that the central bank would slow these stimulus measures later this year, but did not specify when.

The output revisions “should give Fed officials more confidence that the recovery is gathering steam,” Paul Ashworth, chief United States economist for Capital Economics, wrote in a client note. Still, he said, “it’s no certainty, and August’s nonfarm payroll figures will be watched closely,” referring to the next jobs snapshot, due out on Sept. 6.

Economists noted that the upward revision for second-quarter G.D.P. addressed one of the puzzles in the data this year, about why hiring seemed to be picking up when output growth remained extraordinarily slow. The divergence between the two indicators did not seem sustainable, and some worried that a major slowdown in employment growth might be on the horizon.

Thursday’s report “adds to the likelihood that the apparent disconnect between employment and G.D.P. will be closed with G.D.P. moving up rather than employment down,” said Jim O’Sullivan, chief United States economist at High Frequency Economics. “Some, but not all, of the disconnect was revised away today.”

Private forecasters seem to be expecting third-quarter growth in the 2 percent range, and did not seem to think that the upwardly revised second quarter brightened the growth picture.

“We continue to judge that a significant ramp up in growth is unlikely, particularly given the ongoing effects of fiscal tightening,” said Peter Newland, an economist at Barclays. Congress’s across-the-board automatic spending cuts have been weighing on the economy, and further cuts may come when the Senate and House convene in September. A fight over the debt ceiling also looms.

Article source: http://www.nytimes.com/2013/08/30/business/economy/second-quarter-gdp-revised-sharply-higher.html?partner=rss&emc=rss

Small-Business Guide: Figuring Out What Time Is the Right Time to Start Hiring

First, he needs more people in the warmer months. He also has to consider where his jobs are and how long it will take his workers to drive from one job to another. Some jobs take longer than others, because vacuuming and scrubbing take more time than chemical treatments. Plus, he said, “Everyone wants their residential pool service on Friday.”

Of course, like most business owners, Mr. Johnson always wants to avoid having too many people and not enough work.

“Determining when and how many employees to hire is a bit tricky for our business as the demand for services varies based on account growth, seasonality, geography of homeowner addresses and customer requests,” said Mr. Johnson, who started the company four years ago.

Many small-business owners remain skittish about hiring. The National Federation of Independent Business reported that nearly 80 percent of small, private companies made no hiring changes in July and 12 percent let workers go.

Especially after the recession, many owners have been reluctant to spend the money to hire workers, especially if there’s a chance demand will recede and the workers will have to be laid off. The on-again, off-again recovery hasn’t helped. And with small businesses representing 49.2 percent of private sector employment, according to the Small Business Administration, this reluctance has inevitably had an impact on unemployment rates.

Some owners have turned to paying overtime, which makes it easier to scale back if demand slips. The downside is that it can be expensive and it can lead to an overworked staff.

For example, the work force at Narragansett Creamery in Providence, R.I., has grown slowly even as more customers are drawn to the company’s homemade yogurt and cheeses, said Mark Federico, the owner. Started in 2007, the company has grown to a staff of 30.

“We found that if we worked too many hours for too long a period of time, people get burned out,” Mr. Federico said. “People need days off. It’s not scientific, and we’re not right all the time.”

Based on the experiences of owners like Mr. Johnson and Mr. Federico, this small-business guide looks how owners determine when it’s time to hire.

HOURS WORKED Mr. Johnson said he ran his employment numbers weekly, as clients were added and lost, to ensure he had enough people. He uses a spreadsheet to help him decide when the company can support the wages of new employees.

He keeps careful count of the number of pools the company cleans and the hours required for each job. He separates residential jobs, which typically require 30 minutes of time, from those at commercial pools, which can take two hours.

To calculate the required number of employees, Mr. Johnson estimates the number of hours required to clean all client pools and divides that by a standard 40-hour workweek. When the result is greater than the number of employees on staff, he makes a new hire.

THE PAYROLL PERCENTAGE Earlier this year, when there was a surge in demand for swimming lessons at SwimLabs, in Highlands Ranch, Colo., Michael Mann was taken by surprise. Suddenly, the 15 full-time employees he keeps during the off-season — as opposed to 25 or more during spring and summer — were not enough.

Opened in 2006, SwimLabs offers one-on-one lessons to children and adults. All students are videotaped and analyzed as they take their strokes in small pools equipped with water jets.

The company saw the same surge in business after the 2012 Summer Olympics.

“The Olympics always elevates the sport,” said Mr. Mann, who holds several masters swimming records. His business got an extra boost because the four-time gold medalist Missy Franklin lived nearby.

To decide how many instructors he needed to hire, Mr. Mann looked at monthly gross earnings and calculated that the payroll should consume a maximum of 25 percent of his operating costs. If he generates an additional $10,000 a month in revenue, he knows he can afford another instructor who is paid $2,500 a month. As a result, Mr. Mann started hunting for two more part-time instructors.

CALL VOLUME Growth can be deceptive. Sometimes, efficiencies may keep three times as many customers from meaning three times as much work. That is a lesson learned by Hudl, a company in Lincoln, Neb., that builds video analysis tools for coaches in 20 different sports, allowing them to break down plays and share them with their players.

The company’s big market is high school football. In the 2011 season, its six-person service team went from working with 2,000 teams to working with more than 6,600. “We were staying up all night” to manage problems like software bugs, said Bryant Bone, who heads the support team. Clearly, Hudl needed help.

Article source: http://www.nytimes.com/2013/08/29/business/smallbusiness/figuring-out-when-its-time-to-add-an-employee.html?partner=rss&emc=rss

New Home Sales Fall Sharply; House Prices Rise

Sales dropped 13.4 percent to an annual rate of 394,000 units, the Commerce Department said on Friday.

The reading, which was well below economists’ expectations, could be a sign that a recent surge in mortgage rates is weighing on the economy, although the data is often subject to large revisions.

The report could weaken the case for the U.S. Federal Reserve to reduce its support for the economy by trimming monthly bond purchases later this year.

“The higher mortgage rates are having an impact on the housing market,” said Scott Brown, chief economist with Raymond James in St. Petersburg, Florida. “That makes tapering (bond purchases) somewhat less likely.”

The government revised sharply lower its estimate for new home sales in May and June.

Yields on U.S. government debt dropped sharply and the dollar weakened following the release of the data, a sign that some investors were scaling back bets that the Fed would trim its $85 billion in monthly bond purchases next month.

Mortgage rates have risen sharply since May on bets that the Fed would soon begin tapering its bond purchases. The stimulus program is designed to lower interest rates to make it easier for businesses to expand and take on new workers.

The housing market, which has been a major drag on the U.S. economy since the 2007-09 recession, appeared to turn a corner early last year when home prices began to rise.

Last month, the median price for a new home sale rose to $257,200, up from $237,400 in the same month of 2012.

There have been indications that higher borrowing costs are having only a limited impact on the overall housing market.

Sales of existing homes, a much larger category than new homes, surged to a three-year high last month. Some analysts speculated, however, that home buyers rushed into the market to lock in mortgage rates before they rose further.

Construction of new homes has accelerated over the last year, and the inventory of new homes for sale increased by 4.3 percent in July from June.

Rising inventories could slow the rapid and arguably unsustainable price gains seen over the past year. If that occurred in step with a moderate rise in interest rates, the overall housing market could become healthier in the long term.

“(In) the end it will make it the housing recovery a more durable one,” said Lindsey Piegza, chief economist with Sterne Agee Leach in Chicago.

At July’s sales pace it would take 5.2 months to clear the houses on the market, up from 4.3 months in June. A supply of six months is normally considered a healthy balance between supply and demand.

(Reporting by Jason Lange; Additional reporting by Richard Leong in New York; Editing by Paul Simao)

Article source: http://www.nytimes.com/reuters/2013/08/23/business/23reuters-usa-economy.html?partner=rss&emc=rss

U.S. Median Income Rises, but Is Still 6% Below Its 2007 Peak

The study, issued on Wednesday by two former Census Bureau officials, suggests why many people remain glum even though the economy is growing and unemployment has declined.

Although inflation-adjusted median annual household income rose to $52,100 in June, from its recent trough of $50,700 in August 2011, it remained $2,400 lower — a 4.4 percent decline — than in June 2009, when the recession ended. This drop, combined with the 1.8 percent decline that occurred during the recession, leaves median household income 6.1 percent — or $3,400 — below its level in December 2007, when the economic slump began.

Since the end of the recession, the study said, household income has declined for all but a few population groups. Some of the largest percentage declines occurred for groups whose income was already well below the median, like African-Americans, Southerners, people who did not attend college, and households headed by people under age 25.

“Groups with low incomes tended to have steeper declines in income,” said Gordon W. Green Jr., who wrote the report with John F. Coder, a colleague at Sentier Research, which specializes in analyzing household economic data.

Households headed by people ages 65 to 74 were the only group in the study that experienced a statistically significant increase in post-recession income, helped both by the continued increase in Social Security benefits and by the decision of some older workers to remain in the work force or re-enter it.

The figures, adjusted for changes in the cost of living over time, include income before taxes and exclude capital gains. The number of households with income above the median is the same as the number below it.

The data offers a potential preview of the official Census Bureau statistics on income and poverty for 2012, scheduled to be released next month. The Sentier data is based on the Current Population Survey, a monthly government survey of about 50,000 households. The researchers used the same definition of income as the Census Bureau uses in its annual report on income and poverty. The two sets of estimates have shown broadly similar trends in recent years.

Because recessions rarely match up perfectly with calendar years, the annual census data often does not allow for precise comparisons with the start and end of downturns. The most recent downturn ended in June 2009, according to a committee of academic economists widely considered to the arbiter of the business cycle.

The economy has been growing since 2009, but more slowly and inconsistently than many Americans would like and many economists and policy makers had predicted. President Obama has made the economy’s condition his main focus this summer, promising new efforts to encourage economic growth, including a series of proposals on higher education that he is expected to announce Thursday. While taking credit for some improvement in the economy, he has acknowledged that many Americans have yet to see the benefits.

“We’ve got more work to do,” Mr. Obama said last month at Knox College in Galesburg, Ill. “Even though our businesses are creating new jobs and have broken record profits, nearly all the income gains of the past 10 years have continued to flow to the top 1 percent. The average C.E.O. has gotten a raise of nearly 40 percent since 2009. The average American earns less than he or she did in 1999.”

In the recession and its aftermath, many people went back to school, earning associate or bachelor’s degrees. Such credentials have helped, the new data shows, but they have been no guarantee against loss of income.

Households headed by people with only a high school diploma have seen their post-recession income decline by 9.3 percent, to $39,300 in June of this year, the report said. For households headed by people with an associate degree, median income declined by 8.6 percent in those four years, to $56,400. And among households headed by people with a bachelor’s degree or more, median income declined by 6.5 percent, to $84,700.

Since the end of the recession, the report said, income has declined by 3.6 percent for non-Hispanic white households, to $58,000, and by 4.5 percent for Hispanic households, to $40,979. Those changes were smaller than the 10.9 percent decline, to $33,500, for non-Hispanic black households, whose economic problems are likely to be a focus when Mr. Obama speaks next week on the 50th anniversary of the March on Washington.

Median income for households headed by people 65 to 74 years old increased by 5.1 percent, to $43,000, even though in many cases the head of the household was retired. By comparison, median income for households headed by people under age 25 fell 9.6 percent in the last four years, to $31,300.

Median income declined by 4.5 percent for households headed by a person 25 to 34 years old, by 5.7 percent for those 35 to 44, by 2.5 percent for those 45 to 54, and by 7 percent for those 55 to 64. The report found no significant change for households headed by a person 75 or older.

Median income declined for households in three of the four major geographic regions, with the South showing the largest decline and the Midwest reporting no statistically significant change.

From June 2009 to June of this year, household income declined by 6.2 percent in the South, to $47,900; by 5.2 percent in the West, to $56,400; and by 3.9 percent in the Northeast, to $56,800.

By contrast, household income in the Midwest, $52,600, was not significantly different from what it was four years ago. Some parts of the Midwest have been helped by the natural-gas boom, while others have benefited from a modest manufacturing rebound in the last few years.

Article source: http://www.nytimes.com/2013/08/22/us/politics/us-median-income-rises-but-is-still-6-below-its-2007-peak.html?partner=rss&emc=rss

Off the Charts: Jobs Recovery in Europe Is Also Painfully Slow

The decline was not large — 24,000 jobs, or 0.1 percent of the 19.3 million people out of work in May. But it was the first month in more than two years that there had been a decline.

Some, but not all, of that decline was in Germany, where unemployment has been falling even as it rose in other countries. Other euro zone countries that reported declines during the month were Austria, Finland, Ireland, Italy, Portugal, Slovenia and Spain. Two of the 17 countries in the zone, Estonia and Greece, have yet to report.

The accompanying charts show how the number of people unemployed has risen or fallen since March 2008, the month that overall unemployment in the euro zone hit its recent low. The charts also show the trends in two major countries outside the zone, Britain and the United States, where unemployment had bottomed out earlier. In the United States, the low was reached in October 2006, more than a year before the recession officially began.

It should be noted that the number of unemployed workers does not exactly equate to the number of people without jobs, which may be changing at a faster or slower rate. Discouraged workers who conclude they cannot get a job can drop out of the labor force, and thus not be counted. But when things begin to improve, those people can begin to search for employment and be newly counted among the unemployed.

Perhaps the most striking thing about the charts is how little improvement there has been in most of the countries shown. Germany is the striking exception to that, of course, and the number of unemployed in the United States has been falling steadily, if slowly, since 2010. On Friday, the government reported that the American unemployment rate fell to 7.4 percent in July, the lowest since December 2008. The number of people out of work in Britain fell in 2012 but has stabilized in recent months.

Among the most troubled countries in the euro zone, only in Ireland has there been a significant decline in the number of unemployed workers, although the figure remains nearly one and a half times as high as it was in 2008. In Greece, the number out of work appeared to stabilize late last year, but it began to rise again this year and was at the highest level yet in April, the last month for which data was available.

Perhaps the most extraordinary development has been in the Netherlands, where the number of unemployed workers has begun to rise rapidly after rising relatively slowly early in the credit crisis. Nonetheless, the latest unemployment rate for the Netherlands is only 6.8 percent, a figure that is lower than that of either the United States or Britain and about half the rate in Ireland.

For some countries, the reported unemployment rates remain very high. Although the number of unemployed workers in Portugal was reported to have fallen in both May and June, the unemployment rate remains at 17.4 percent, not far below the high of 17.8 percent reached in April. In neighboring Spain, two months of falling unemployment have reduced the rate by only 0.2 percentage points, to 26.3 percent. At least Spain no longer ranks as having the highest unemployment rate in the euro zone, as it did at the end of 2012. Greece, at 26.9 percent at last report, has regained that unfortunate position.

Floyd Norris comments on finance and the economy at nytimes.com/economix.

Article source: http://www.nytimes.com/2013/08/03/business/economy/in-europe-too-a-painfully-slow-jobs-recovery.html?partner=rss&emc=rss

European Central Bank Keeps Key Rate at 0.5%

“The picture seems to be better from all angles than it was a year ago,” Mr. Draghi said at a news conference after the E.C.B.’s decision to leave its benchmark interest rate unchanged at a record low of 0.5 percent.

Mr. Draghi was referring to questions about the euro zone’s integrity, though, and less to the immediate prospects for an end to recession and record unemployment.

The fragile state of the euro zone economy means that any decision to raise interest rates is still a long way off, Mr. Draghi indicated. Policy makers expect “the key E.C.B. interest rates to remain at present or lower levels for an extended period of time,” Mr. Draghi said, repeating a pledge he first made a month earlier.

In London on Thursday, Britain’s central bank, the Bank of England, also decided to hold interest rates steady.

The Bank of England held its interest rate at 0.5 percent, already a record low, and made no change to its program of economic stimulus, leaving the target at £375 billion, or about $570 billion. In Britain, which does not use the euro, the government had reported last week that the economy grew 0.6 percent in the second quarter from the previous quarter and that all main industries were reporting faster growth for the first time in three years.

For Mr. Draghi, it has been about a year since he defused fears of a euro zone breakup by promising to do “whatever it takes” to keep the common currency together. That expression of resolve helped check the euro zone’s decline, but was not enough to push the region onto a growth pathagain.

Asked to take stock of the state of the euro zone today, Mr. Draghi listed numerous improvements, including stronger exports from countries like Spain and Italy; lower market interest rates for government bonds; and progress by political leaders in reducing their deficits and improving economic performance.

“We are seeing possibly the first signs this significant improvement in confidence and interest rates is finding its way to the economy,” Mr. Draghi said.

But he took a more cautious view than many analysts of recent surveys of business sentiment, which have raised hopes that the euro zone economy could be emerging from recession. The surveys “tentatively confirm the expectation of a stabilization of economic activity at low levels,” Mr. Draghi said.

At least one analyst detected a nuanced shift in Mr. Draghi’s assessment.

“If there was any change at all, his description of economic prospects sounded slightly more optimistic,” Jörg Krämer, chief economist at Commerzbank in Frankfurt, said in a note to clients.

“Slightly” is the key word. Credit for businesses remains scarce, Mr. Draghi noted, and the labor market is weak. Unemployment in the euro zone was stuck at a record high of 12.1 percent in June, according to official data published Wednesday, though there was an infinitesimal decline in the total number of jobless people: 24,000 fewer people were out of work in May out of a total of 19 million.

Even if the euro zone economy does emerge from recession soon, economists say, growth will be weak and it will take years before joblessness in countries like Spain — where more than a quarter of the work force is unemployed — returns to tolerable levels.

With E.C.B. interest rates already at record lows, Mr. Draghi has in recent months been trying to use his powers of persuasion to talk down market rates and make credit more available to businesses and consumers. Last month, he broke with precedent by promising to keep rates low for an extended period. Before then, the E.C.B. had refused to offer so-called forward guidance.

Julia Werdigier contributed reporting from London.

Article source: http://www.nytimes.com/2013/08/02/business/global/european-central-bank-keeps-key-rate-at-0-5.html?partner=rss&emc=rss

Shortcuts: Unemployed and Older, and Facing a Jobless Future

She wonders how to support him in his continued quest to find a job in his field of marketing and financial services while at the same time encouraging him to think about what his life would be like if he never worked in that field or had a full-time job again.

“I wanted to move to what I thought was a healthier place. I wanted to turn the page,” said my friend, who asked to be identified by her middle name, Shelley, since she didn’t want to publicize her family’s situation. “He saw it as vote of no confidence.”

For those over 50 and unemployed, the statistics are grim. While unemployment rates for Americans nearing retirement are lower than for young people who are recently out of school, once out of a job, older workers have a much harder time finding work. Over the last year, according to the Department of Labor, the average duration of unemployment for older people was 53 weeks, compared with 19 weeks for teenagers.

There are numerous reasons — older workers have been hit both by the recession and globalization. They’re more likely to have been laid off from industries that are downsizing, and since their salaries tend to be higher than those of younger workers, they’re attractive targets if layoffs are needed.

Even as they do all the things they’re told to do — network, improve those computer skills, find a new passion and turn it into a job — many struggle with the question of whether their working life as they once knew it is essentially over.

This is something professionals who work with and research the older unemployed say needs to be addressed better than it is now. Helping people figure out how to cope with a future that may not include work, while at the same time encouraging them in their job searches, is a difficult balance, said Nadya Fouad, a professor of educational psychology at the University of Wisconsin-Milwaukee.

Psychologists and others who counsel this cohort need to help them face the grief of losing a job, and also to understand that jobs and job-hunting are far different now from how they used to be.

“The contract used to be, ‘I am a loyal employee and you are a loyal employer. I promise to work for you my entire career and you train, promote, give benefits and a pension when I retire.’ Now you can’t count on any of that,” she said. “The onus is all on the employee to have a portfolio of skills that can be transferable.”

People in their 20s and 30s know that they need to market themselves and always be on the lookout for better opportunities, she said, something that may seem foreign to those in their 50s and 60s.

If a counselor or psychologist “doesn’t understand how the world of work has changed, they’re not helping at all,” she said. “You can’t just talk about how it feels.”

In response to this concern, Professor Fouad and her colleagues have drawn up guidelines for the American Psychological Association to help psychotherapists better assist their clients with workplace issues and unemployment. It is wending its way through the association’s committees.

Of course, not everyone who is unemployed and over 50 is equal. For some, the reality is that they need to find another job – any job – to survive. Others have resources that can allow them to spend more time looking for a job that might have the salary or status of their former position.

In the first case, Professor Fouad said, “You need to decide what is the minimum amount of money you can make and how to go about finding it.” In the second case, she said, it’s necessary to examine what work means to you and how that may have to change.

Is it the high social status? The identity? The relationship with co-workers?

It is important to examine these areas, perhaps with the help of a professional counselor, Professor Fouad said, to discover how to find such meaning or relationships in other areas of life.

Sometimes simply changing the way you look at your situation can help.

E-mail: shortcuts@nytimes.com

Article source: http://www.nytimes.com/2013/07/27/your-money/unemployed-and-older-and-facing-a-jobless-future.html?partner=rss&emc=rss

Today’s Economist: Policy Impact and Red Herrings

DESCRIPTION

Casey B. Mulligan is an economics professor at the University of Chicago. He is the author of “The Redistribution Recession: How Labor Market Distortions Contracted the Economy.”

Red herrings are frequently inserted into policy discussions but can be readily identified as long as we remember a simple truth about public policy impact.

Today’s Economist

Perspectives from expert contributors.

The impact of public policy on an economic outcome like employment is, by definition, the difference between employment with the policy in place and what employment would have been under an alternative “baseline” policy. Policy impact quantifies how things are different as a consequence of the policy.

Consider these statements:

“The Affordable Care Act will not reduce full-time employment because workers understand that full-time employment is the path to career advancement” (see my previous post).

“Unemployment insurance does not reduce employment because Americans fundamentally want to work and provide for themselves” (see, for example, this commentary on gawker.com)

These are all examples of red herrings, irrelevant statements that are attached to hypotheses.

Take the full-time employment example. It may be true that full-time employment is the path to career advancement, but that is hardly relevant to the Affordable Care Act as long as we assume that full-time employment would be that path regardless of whether we have that law.

That is, lots of people will choose full-time employment because of the career opportunities it provides, but they are counted as full-time employed under the policy and as full-time employed under the baseline policy (say, continuing as if the act had never become law). A policy impact estimate, by definition, counts only those for whom career advancement does not trump their decision to be in a full-time position.

As I explained in that an earlier post, the Affordable Care Act introduces funds and insurance opportunities for part-time employees that will be unavailable to most full-time employees. As long as there are more than zero people whose full-time vs. part-time work decision depends on funds or insurance, there is the potential for policy impact.

In my second example, it may be true that most people want to work and provide for themselves. But I assume motivation to work is the same regardless of whether unemployment benefits are paid for, say, 99 nine weeks or 26. What’s different between the 99-week policy and the 26-week baseline are the circumstances in which people find themselves.

As long as motivation is not the sole factor determining employment, there is the potential for unemployment insurance to have a policy impact, even in a country in which the people are fundamentally hard-working.

Nobody expects a government program to make everything different. So policy analysis is particularly useful in subtracting out the outcomes that would occur regardless of policy measures.

Article source: http://economix.blogs.nytimes.com/2013/07/17/policy-impact-and-red-herrings/?partner=rss&emc=rss

Economix Blog: Understating Job Growth

CATHERINE RAMPELL

CATHERINE RAMPELL

Dollars to doughnuts.

One of the many bright spots in the June jobs report was that April and May had their employment gains revised upward by a combined 70,000 jobs. In other words, job growth in those months was actually better than originally reported.

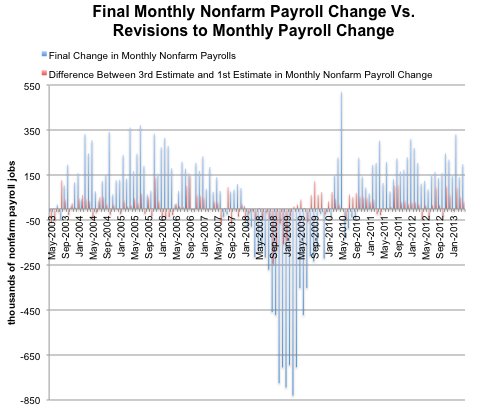
Which brings me to a peculiar trend, first brought to my attention in May by Justin Wolfers: Most months during the recovery — 37 of the 47 months for which we now have a third estimate of employment — the Labor Department initially understated job gains. And most months during the recession — 13 of the 18 months — the bureau initially understated job losses.

Source: Bureau of Labor Statistics, via Haver Analytics. Source: Bureau of Labor Statistics, via Haver Analytics.

That is to say, the revisions have been largely pro-cyclical. Job changes were better than we originally thought when they were good, and they were worse than we originally thought when they were bad.

I’m not sure what explains these patterns. Revisions in previous cycles do not seem to have been as heavily pro-cyclical; there was more of a balance between upward revisions and downward ones in both recessions and expansions. (If you have any potential explanations for the change — other than pure chance — please share your thoughts in the comments.)

I also wonder what effect the repeated understating of monthly job growth might be having on the recovery.

Would consumers, employers and investors be more optimistic (and willing to spend more money) if the original jobs estimate each month (which gets the most press) reflected the stronger hiring that later became evident? Or am I overestimating how much the official numbers affect behavior?

Article source: http://economix.blogs.nytimes.com/2013/07/05/understating-job-growth/?partner=rss&emc=rss