November 15, 2024

You’re the Boss Blog: Why I Pay What I Pay

Staying Alive

The struggles of a business trying to survive.

Sometimes, when I sit down to write, I focus on documenting a recent experience. Other times, I think about things that I would like to know about other businesses but have never seen publicly discussed. This post is the latter. It’s about how business owners decide what to pay their employees.

I’ve been thinking about wages and wondering whether I am paying my people too much, too little, or just the right amount. I don’t have a good way to answer that question, but I thought that it might be interesting for me to list what I expect to get for various hourly wages, starting at the minimum and working up the scale. I’ll be eager to see your thoughts in the comment section.

I have to preface the list with a little background. My willingness to pay a given wage to a given person is influenced both by the relative scarcity of trained woodworkers with the skills I need and by the cost of living in my location, suburban Philadelphia. I am also going to omit, for the purpose of simplicity, the cost of benefits that we offer (paid vacation, retirement plan, health insurance and, coming soon, profit sharing). My benefit costs for each of my workers depends on that person’s years with the company (we offer more vacation time for longtime employees) and family structure, which drives health insurance purchases.

I also want to stick to wages for shop-floor workers. There is a lot of chatter about manufacturing jobs in the media, and these are generally hourly positions. The salaried and administrative positions in my company do not fit into any neat categories, because of the specialized nature of our work. So I’m not going to include them in the analysis. That said, let’s start at the bottom:

Minimum wage (in Pennsylvania, $7.25/hour): I don’t expect much for this, beyond a pulse. I don’t think it’s enough for any adult to live on, as it would be difficult to afford a stable living and transportation situation. It might be appropriate for the unskilled, youths or temporary workers, but that is not what I want.

$10/hour: This is my starting wage. For this I expect workers without much in the way of skills but who are reliable about showing up on time and work at a steady pace. They should be able to learn simple tasks (taking out trash, unloading materials) and perform them correctly. They should understand English well enough to take simple directions.

$12/hour: If the $10/hour employees work out and show some ability to learn the simpler technical tasks that we perform while we build our products, I can pay them a little more. I would expect them to perform a set of simple tasks on a regular schedule without supervision and to demonstrate a willingness to work on a flexible schedule. They should also have a valid driver’s license and be willing to work a flexible schedule and long hours when we need to make out-of-state deliveries. (They will be paid overtime for more than 40 hours of labor per week.) They should understand complex spoken English.

This is also where we start workers who have the desire to become skilled woodworkers but have had no training. This class of workers requires significant attention from management and co-workers, so we can’t pay them much. They need to demonstrate a good work ethic, curiosity and willingness to take direction. And, they need to show some talent, which we call “good hands.” This ability is not evenly distributed in the population, and it cannot be taught.

$13.50/hour: This wage is for workers who can speak English sufficiently to convey technical information back to the supervisor. For a worker on the training path, a raise to this level would be a reward for steady progress in acquiring our specialized skill set, and continued reliability and hard work.

$15/hour: This is where I start workers who have had general training in woodworking but do not have experience in the specialized skills that we use. Most woodworking training programs emphasize skills that are, in my shop, obsolete. We do not work with hand tools very often and our equipment is much more sophisticated than that found in schools. So workers fresh out of technical school will need significant training, and we will also have to determine whether they have good hands and a good work ethic.

$18/hour: I would pay this for workers who have had both technical schooling and some experience in another wood shop and whose skills and work ethic have been vouched for by former bosses. I still need to see whether these workers can perform at our level of speed and accuracy, which is higher than the industry average. And we will still need to put a significant effort into expanding their skill set to include the specialized work that we do.

$20/hour: This is what I pay workers who have been with me for sufficient time to learn our procedures and perform at a level where they can do most tasks most of the time without error. As custom makers, we do a very wide variety of projects and have an enormous library of designs. It takes a while for workers to encounter every item we make, because we do not produce every one of our designs regularly. I keep workers in this wage range until they can do a wide range of items without problem. Also, at this level they should not need constant attention from management.

$25/hour: These employees should have mastered every aspect of their jobs. They should be able to manage a helper if required. And they should be able to contribute ideas that improve our operations. This is also where I would start workers who come to us with previous experience doing work similar to ours. Most workers who can make that claim have many years of experience in other shops and a wide range of skills. Unfortunately, many of those skills are no longer needed in modern manufacturing. But their mastery indicates a dedication to acquiring and upgrading skills.

$30/hour: This is foreman-level pay, earned by a worker with complete mastery of both our particular skills and the wider demands of the trade. This worker should be an energetic and innovative leader, able to monitor all the activity in the shop, to provide direction to other workers when required and drive innovation in our procedures. This person will work closely with me and with the office staff and is likely to work a lot of overtime, which enhances pay.

So that’s my wage picture. You might break it down this way: the first $10/hour gets you reliability, the next $10/hour gets you a skill adequate to do our regular production, and the next $10/hour buys all of the extras. One of the paradoxes is that many of those extras are skills that we do not actually use anymore. Anyone who has been around long enough to get to master level has experienced the revolution in manufacturing that I have seen since I started my business in 1986. Back then, the machines were dumb and the workers were brilliant. Now the machines are a lot smarter, and some of the requirement for employee brilliance has been eliminated. Since we are custom makers, however, we occasionally end up doing something that could be done by machine but will require a lot of investment in programming and tooling. It is faster to push it out to the shop floor and let them figure it out. That’s when the master-level workers shine.

I want to close by repeating that this is what happens in my own shop. Different companies, in different industries, and in different locations, may end up with very different numbers. I welcome any thoughts on what I have written.

Paul Downs founded Paul Downs Cabinetmakers in 1986. It is based outside Philadelphia.

Article source: http://boss.blogs.nytimes.com/2013/04/23/why-i-pay-what-i-pay/?partner=rss&emc=rss

Today’s Economist: Casey B. Mulligan: The Rise and Fall of Wages

DESCRIPTION

Casey B. Mulligan is an economics professor at the University of Chicago.

Aggregate wage-rate data show no sign of the huge and prolonged demand shock said to have hit the economy in 2008. Instead, they bear the fingerprints of an expanded social-safety net.

Today’s Economist

Perspectives from expert contributors.

A conventional narrative of the American labor market since 2007 is that the demand for labor collapsed, so that despite a uniformly willing and eager work force, millions of people had to go without jobs. This narrative is an aggregate theory and not primarily about sectoral shifts that would depress demand for some types of labor and increase it for others. If this narrative is accurate, it should be visible in aggregate wage-rate data.

At a minimum, the aggregate demand collapse should have frozen wage rates in dollar terms, so that inflation-adjusted wages would erode with inflation as consumer prices crept up. With the price index for consumer items 8 percent higher at the end of 2011 than it was when the recession began, inflation-adjusted hourly wages should have fallen at least 8 percent over that time frame, if not more.

In my view, the change in aggregate demand has been heavily exaggerated, and the greater impulse affecting the labor market over the last five years has been higher marginal tax rates created by an expanding social safety net of unemployment insurance, food stamps, Medicare and other anti-poverty programs. Those tax rates, as I noted last week, refer “to the extra taxes paid, and subsidies forgone, as a result of working, expressed as a ratio to the income from working.”

I expected real wage rates (and hourly labor productivity) to rise in the short term, and to do so a couple of percentage points above the previous upward trend made possible by continuing progress of the productivity of labor and capital.

Marginal tax rates increase real wage rates a few percentage points in the short term because, with more help during unemployment, employees at struggling businesses have less reason to make some of the concessions in wages and working conditions that can help the employer to retain employees affordably.

As I explain in “The Redistribution Recession,” wage rates would quickly fall back toward the trend line when some of the temporary safety-net measures began to expire, which was two or three years after the recession began.

Those safety-net expansions that were permanent would eventually reduce average real wage rates, as people out of work reduced their human capital investment. This reduction might reflect people who, because they no longer practice a trade, lose contacts in the workplace or no longer maintain a wardrobe or tools they need for work. (For more on this effect, see especially the literature on women’s wage trends.) Unfortunately, these wage reductions do not encourage employers to hire because they derive from reductions in productivity.

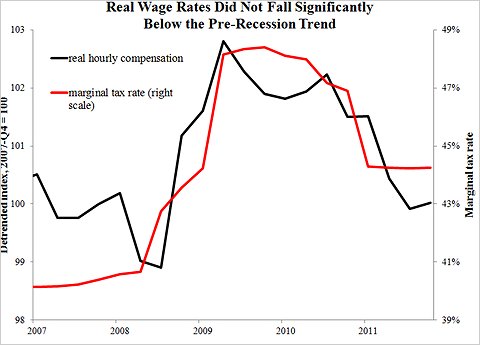
The black series in Chart 1 below shows aggregate real wage rates measured as inflation-adjusted employee compensation (including fringe benefits like health insurance) per hour worked. I have removed an upward trend, because for short-run analysis it is interesting to look at deviations from trends. Under normal conditions real wages can increase with productivity even while the amount of labor is neither rising nor falling.

The trend adjustment is 0.5 percent a year, based on the average rate of growth of total factor productivity during the four years before the recession. Without the trend adjustment, the black series would increase two percentage points more through 2011 than shown.The trend adjustment is 0.5 percent a year, based on the average rate of growth of total factor productivity during the four years before the recession. Without the trend adjustment, the black series would increase two percentage points more through 2011 than shown.

The chart also shows in red the marginal tax rate on labor income measured in my book for a typical household head or spouse based on the ever-changing eligibility and benefit rules for safety-net programs. Sure enough, real hourly compensation increased during the recession and did so about a quarter after marginal tax rates began their increase.

Marginal tax rates were high and fairly flat during 2009 and early 2010 as the “stimulus” law was in full force. During this time, real wages failed to fall back anywhere close to their prerecession values. Only when some of the stimulus provisions began to expire, reflected in a marginal tax rate that falls to 44 or 45 percent from 48 percent, did real wage rates decline quickly and significantly.

Even after the decline in late 2010 and early 2011, it looks as though real wage rates are about where the previous trend line was, rather than being the several percentage points below what one might expect after a huge, prolonged demand shock.

A few economists have used Census Bureau wage data, which ignore the fringe benefits from employment, to show that wages fell during 2010 and 2011. It is incorrect to ignore fringe benefits (I discuss this and other wage measurement issues in Chapter 2 of “The Redistribution Recession”), but the choice of series is just a quibble, because none of the aggregate wage measures display a cumulative decline that would be commensurate with the huge, prolonged demand collapse said to have occurred.

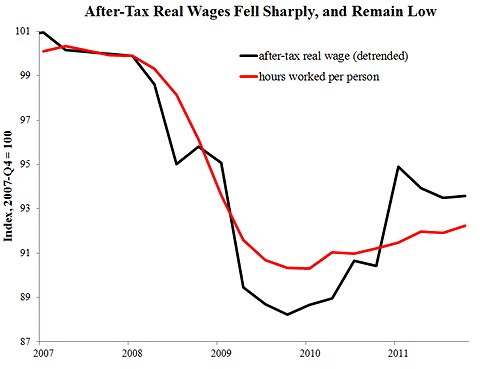
A magnifying glass is not required to see a decline in after-tax real wage rates. The after-tax real wage rate (calculated as the product of real hourly compensation and one minus the marginal tax rate) shown in black in Chart 2 reflects the net financial reward per hour of working, taking into account taxes and safety-net subsidies.

TKTKTKTKThe after-tax real wage series has been adjusted for a trend of 0.5 percent a year.

Marginal tax-rate changes, such as those created by an expanding social safety net, cause deviations between the real hourly compensation shown in Chart 1 and the after-tax series shown in Chart 2. In theory, the downward marginal tax rate effect on after-tax real wages exceeds the upward effect on real hourly compensation.

In fact, after-tax real wages fell a startling 12 percent below the trend line during the first two years of the recession (note that each tick in Chart 2 is twice as large as each tick in Chart 1). They rebounded somewhat as marginal tax rates came off their stimulus highs but still remain six or seven percentage points below the trend line.

The quantity of labor — hours worked per capita including zeros for people not working – is shown as a red series in Chart 2. Remarkably, labor and after-tax real wage rates collapse together, hit bottom together and exhibit a partial recovery together.

Helping the poor and unemployed is intrinsically valuable, but is not free. It has made labor more expensive and depresses employment.

Article source: http://economix.blogs.nytimes.com/2012/10/03/the-rise-and-fall-of-wages/?partner=rss&emc=rss

Economic View: The Sad Statistic That Trumps the Others

Productivity statistics are hardly exciting reading, but they are important. Our society is wealthy precisely because it can churn out products like automobiles, flush toilets and Google search algorithms at relatively low cost. Productivity slowdowns mean erosion of living standards over the long haul, and they also can lead to short-term crises. If productivity turns out to be much lower than expected, it often means that we have borrowed too much and taken on too much risk. Retrenchment can make a recession longer and deeper.

The overlooked piece of news came this month from the Bureau of Labor Statistics. In the second quarter this year, it reported, nonfarm business labor productivity fell by 0.3 percent, the second quarterly drop in a row. And it turns out that it rose only 0.8 percent from the second quarter of 2010. Over the last year, hourly wages have risen more quickly than productivity.

These factors have helped to keep the labor market sluggish and have thwarted a potential recovery.

Yet these numbers don’t capture the entire issue, and are themselves plagued by an array of problems. One bias in the economic statistics — which never shows up in published revisions — is embedded in the health care sector, where third-party payments, subsidies and care quality are hard to monitor and measure. A result is that a dollar spent on health care does not necessarily mean a true dollar’s worth of value added. The United States spends more per capita on health care than any other country, yet without producing measurably superior results. To the extent that some of these expenditures are wasteful, the gross domestic product and productivity numbers overstate economic growth.

Here’s another problem: Expenditures on the military and domestic security have risen since 9/11, but those investments are intended to neutralize external threats. Even if you agree with this spending, it generally doesn’t produce useful goods and services that raise our standard of living.

One of the most commonly cited productivity numbers describes per-hour labor productivity, but this, too, has intrinsic flaws. Labor force participation has been falling for more than a decade, and low-skilled workers are leaving the work force in disproportionate numbers. Taking some lower-paying jobs out of the mix will raise the measure for average productivity, which is hardly the same as increasing the economic gains from a given set of workers or, for that matter, from putting more people to work by making them more productive.

It is increasingly clear that many of our current economic problems predate the financial crisis, even if the crisis accelerated them or brought them into clearer view. A recent study by E. J. Reedy and Robert E. Litan, both researchers at the Kaufmann Foundation, found that sluggish job creation was a long-term trend. For instance, job creation from start-ups has fallen every decade since the 1980s, raising the specter of an America with an innovation shortfall.

Keynesians argue that the economy is suffering from a lack of spending or too little “aggregate demand.” That’s a valid point, but innovation is one means of stimulating demand. When the iPad and iPad2 arrived on the market, for example, the spending was there to support them, which suggests that more innovation could help turn around the business cycle.

One problem may be offshoring by American companies, as stressed in a study by Michael Mandel, chief economic strategist of the Progressive Policy Institute, and Susan Houseman, senior economist with the W. E. Upjohn Institute for Employment Research. Some productivity gains from the manufacturing of the iPad are captured by workers in China, who make important parts of the device, rather than by American workers. American companies often save on costs by finding lower wages abroad, not by enhancing the abilities of American workers. That would help explain why measured productivity has often been high over the last decade while despite year-to-year variation domestic wages and job creation have been flat.

My point is not to attack offshoring, which eases innovation and benefits poorer workers in the source countries. In any case, we cannot imprison capital in the United States. The relevant point is that even after the recent downward revisions, the domestic productivity statistics may be understating the bad news.

Finally, there is a growing realization that while the Chinese economy is wonderful for cutting costs and improving manufacturing methods, it will not soon be taking the lead in creating breakthrough products. For all the money spent on R. D. in China, Chinese scientific papers are not cited much abroad and Chinese patents are filed at a low rate internationally, suggesting that they are less than revolutionary. Dan Breznitz, a professor at the Georgia Institute of Technology, and Michael Murphree, a doctoral candidate there, have discussed the incremental nature of Chinese innovation in their new, illuminating book, “Run of the Red Queen.”

In other words, the next wave of major innovation will probably rely on the world’s current scientific leaders, many of whom are based in the United States. Recently, though, Americans have not been getting the job done, and it’s starting to sink in that the real story is the truth on the ground — not the published numbers.

Tyler Cowen is a professor of economics at George Mason University.

Article source: http://feeds.nytimes.com/click.phdo?i=8ea941357924abb87d271a0bb65cabc8

Economix: Where a Minimum-Wage Increase Would Bite

DESCRIPTION

Casey B. Mulligan is an economics professor at the University of Chicago.

Although advertised as a well-deserved raise, another federal minimum-wage increase would eliminate paychecks for some of America’s lowest-skilled workers.

Today’s Economist

Perspectives from expert contributors.

Last week I explained how I estimated that the July 2009 federal minimum-wage increase reduced national employment by about 800,000. That 800,000 is the sum of employment impacts for each of several demographic groups and can therefore be used to estimate which groups were most affected by the wage increase.

For each group distinguished by age and part-time status, I calculated “impact”: the percentage gaps between actual per capita employment after July 2009 and the employment I estimated to occur absent the minimum-wage increase.

For example, I found the part-time employment impact among teenagers to be negative 14 percent: that is, 14 percent fewer teenagers were working part time since July 2009 as a result of the federal minimum-wage increase.

The basic economics of the minimum wage suggests that employment impacts will be greatest among groups with the lowest hourly wages. Teenagers employed part time have particularly low hourly wages, and the hourly wages for teenagers employed full time are not much greater. The percentage impact on people 20 and over working full time should be essentially zero, because 98 or 99 percent of them would make more than the minimum wage anyway (see Table 1 of this paper).

The chart below compares, by group, the minimum-wage increase’s employment impact (vertical axis) to a measure of the hourly wages of the workers in the lowest-paid quarter, shown on the horizontal axis). The diagram shows that impacts are negative, or essentially zero, and that the size of the impact is progressively smaller for groups with higher wages – exactly as economic theory predicts.

Compare, for example, the minus 13 percent impact for teenagers in part-time jobs (25 percent of whom were earning less than $5.17 an hour in 2008 — note that a -0.13 log change is essentially a 13 percent reduction) with the zero percent impact for full-time workers 20 to 54 (75 percent of whom were earning more than $11.76 an hour).

Teenage employment rates have fallen to 25 percent from 35 percent over the last four years. Much of that drop cannot be attributed to the federal minimum wage, but my estimates show that the federal minimum wage was a significant factor.

Profs. William E. Even and David A. Macpherson also studied the recent minimum-wage increases for the Employment Policies Institute, using a different methodology. They focused on teenagers (not distinguishing part time and full time), and their state-level model included three federal minimum-wage increases (2007, 2008 and 2009).

They found that those three increases cost 114,000 teenage jobs (I found 800,000 for all age groups combined, only some of which were teenage employment effects; Prof. David Neumark had estimated that teenage and young-adult employment would be reduced 300,000 as a result of the July 2009 minimum-wage increase).

A minority of states were not affected by federal minimum-wage increases because their own state-legislated minimum wage would exceed even the new higher federal minimum (the federal minimum prevails over the state minimum whenever the former is greater).

Thus, whatever jobs were lost because of the federal increase would be lost in the states — 31, after the 2009 increase — and the District of Columbia (which sets its minimum to be $1 above the federal minimum, so when the federal minimum jumps, do does the district’s). Professors Even and Macpherson’s state-level estimates confirmed that this was, in fact, the case.

For the same reason that my model separately considered teenagers and part-time workers, Professors Even and Macpherson followed their teenagers study with a study of 16-to-24-year-old men with less than a high school diploma. They found that each 10 percent increase in a federal or state minimum wage decreased white employment by 2.5 percent, Hispanic employment by 1.2 percent and black employment by 6.5 percent.

For the time being, at least, it seems that increasing the federal minimum wage again would give a few workers a small raise — but at the cost of eliminating entire paychecks for the young, less educated and least skilled.

Article source: http://feeds.nytimes.com/click.phdo?i=b9c44fb94417fa169bc033e9a747631a