Bruce Bartlett held senior policy roles in the Reagan and George H.W. Bush administrations and served on the staffs of Representatives Jack Kemp and Ron Paul. He is the author of the coming book “The Benefit and the Burden: Tax Reform – Why We Need It and What It Will Take.”.”
Last week, Catherine Rampell posted a commentary on a new Gallup poll on the question of who is “rich” in America. The median threshold in the poll’s responses was that rich is $150,000 a year of income or a net worth of $1 million. Because I have asserted that the rich need to pay more taxes if we are to get out of our fiscal mess, and even Republicans say that government benefits for the rich should be cut off, the question of who is rich is politically important.
Today’s Economist
Perspectives from expert contributors.
The first thing to know is that there is no formal definition of who is rich, middle class or poor. Of course, there is an official definition for the poverty rate, but that figure is just a back of the envelope calculation that has simply been increased by the inflation rate since the 1960s. There are many other ways of calculating the poverty rate that could either raise the poverty threshold or reduce it.
Another problem is that one’s social class is a function of both income and wealth. There are many among the elderly who have little income but may have fairly substantial wealth by, for example, owning a home free and clear. At the other end, there are those with high incomes who are, nevertheless, deeply in debt, perhaps even having a negative net worth.
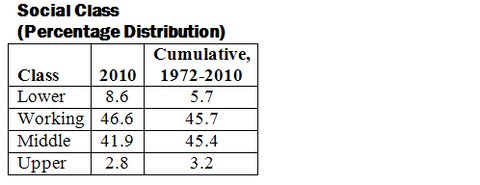
Social class also involves self-identification. According to the General Social Survey at the University of Chicago, which has been asking people what social class they belong to since 1972, more than 90 percent of Americans put themselves squarely in the middle – belonging either to the working class or the middle class.
Historically, less than 6 percent of people identify with the lower class – well below the poverty rate, which was 15.1 percent in 2010 – and about 3 percent with the upper class. Not surprisingly, the economic crisis has increased the ranks of the lower class and working class and reduced the ranks of the middle class and upper class.
 General Social Survey
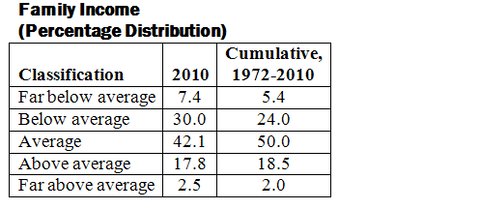
Of course, social class is also a question of perception. A family that has temporarily fallen on hard times might still view itself as belonging to a higher social class than its income justifies. Therefore, it is also useful to look at how people identify their income class. The results are not dissimilar to those above – the vast bulk of people see themselves as being broadly in the middle.
 General Social Survey
Another factor that might shape people’s perceptions of their social class and what, if anything, the government ought to do to improve the distribution of wealth and income is the prevalence of mobility.
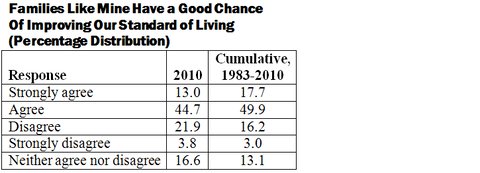
Republicans often oppose policies that would equalize incomes on the grounds that today’s poor could be rich tomorrow and vice versa. Data from the General Social Survey show, by and large, that people believe they have a pretty good chance of improving their economic condition, but probably less so than Republicans believe.
 General Social Survey
These data are confirmed by various New York Times polls, the latest of which, in October, found that 67 percent of people believe it is still possible to start out poor in America and become rich. Only 32 percent said that it was not possible. The peak of optimism came in February 2000, when 84 percent of people said it was possible for average people to become rich. The stock market peaked a month later. The trough came in January 1983, when only 57 percent of people thought they could become rich. That was right on the brink of an economic boom.
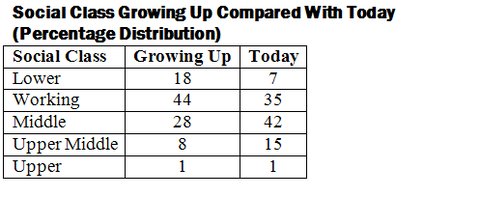
Times polls also cast light on the issue of mobility. In a 2005 poll, people were asked about their social class when they were children compared with today. People generally saw themselves as better off today.
 The New York Times
Since 1989, The Times has asked people whether they think future generations will be as well off as people today. In October, 26 percent said that future generations would be better off, 22 percent said they would be the same and 46 percent said they would be worse off.
The peak of optimism was also in February 2000, when 44 percent said future generations would be better off and 27 percent said they would be worse off. The trough came in March 1995, when 16 percent of people thought future generations would be better off and 58 percent said they would be worse off. This was also right on the brink of an economic boom.
When people are asked whether it is the responsibility of government to reduce income inequality, they mostly disagree, but not strongly. The data for 2010 show an increase in the percentage of people opposed to income redistribution that may reflect the influence of the Tea Party movement.
 General Social Survey
The Times poll in October, however, found that only 26 percent of people thought the distribution of money and wealth was fair, with 66 percent saying it should be more evenly distributed.
Obviously, the question of who is rich in America is extremely fluid. The commonly used threshold of $250,000 is certainly reasonable, but it is nevertheless questioned by those who have such an income but also have equally high expenses, such as children in expensive Ivy League schools.
Article source: http://feeds.nytimes.com/click.phdo?i=61ef356f5988e94adf03706ea38f70f7