November 15, 2024

Joseph E. Granville, Stock Market Predictor, Dies at 90

In early 1981, for instance, the Dow Jones industrial average dived 2.4 percent, on what was then the heaviest trading day in history, after Mr. Granville urged his newsletter followers to “sell everything and go short.” It rebounded in the following weeks before tumbling 23 percent over the next 15 months.

Mr. Granville, who died on Sept. 7 at 90, was perhaps the most famous of a generation of market seers who made their own fortunes in the less risky venue of the newsletter business, in his case The Granville Market Letter, which he began publishing in 1963.

“I’m paid to put you in at the bottom and take you out at the top,” he declared as he barnstormed the country with a showman’s flair, drumming up subscribers at investment seminars choreographed like Broadway shows.

He once dropped to the stage on a 100-foot-long wire wearing his standard After Six tuxedo. He used puppets and clown outfits. He once played a blues song on the piano to underscore his contention that Wall Street brokerages were just out to make money off their customers.

Mr. Granville wrote a daily market letter for E. F. Hutton Company before striking out on his own. At its peak, in the early 1980s, his near-weekly newsletter had 13,000 subscribers. They paid $250 a year — and $500 more for urgent alerts by phone and Telex — as Mr. Granville sought to time the biggest gyrations in the markets.

Louis R. Rukeyser, who often had Mr. Granville on his PBS program, “Wall Street Week,” told People Magazine in 1981 that Mr. Granville was “the most controversial man in American finance.”

But while Mr. Granville correctly called a bear market in the late 1970s and the implosion of technology stocks in 2000, he missed other major turns, like the start of an epic bull run in 1982.

And like many other market forecasters, his overall performance was “very poor” compared with that of basic stock index funds, said Mark Hulbert, editor of The Hulbert Financial Digest, which has tracked the performance of investment advisory newsletters since 1980.

Mr. Hulbert said that from 1980 through January 2005, Mr. Granville’s stock tips for investors lost 0.5 percent on an annualized basis, compared to an 11.9 percent average yearly gain for a general stock index. Mr. Granville’s tips for more aggressive traders lost an average 10 percent a year over that period, Mr. Hulbert said.

Mr. Granville, who continued to produce the newsletter until his death, did not provide enough trading details after January 2005 to track his performance as precisely. But he got enough of the broad turns in the market right, Mr. Hulbert said, that if investors had ignored his stock picks and bought or sold an index fund with each call, they would have earned 8.5 percent a year since 1980.

“He deserves some credit for insight into the market,” Mr. Hulbert said, adding that Mr. Granville created technical indicators still used by many market analysts.

He died in a hospice in Kansas City, Mo., where he was being treated for pneumonia, his wife, Karen E. Granville, said.

Mr. Granville reveled in all the attention his bold calls received, she said. “He loved that,” Mrs. Granville said in an interview. “It was almost like he was on stage all the time.”

Joseph Ensign Granville was born on Aug. 20, 1923, in Yonkers. In “The Book of Granville: Reflections of a Stock Market Prophet,” published in 1984, Mr. Granville recalled that his father had lost $30,000 in the stock market crash of 1929 and “at least twice as much more that he borrowed from Grandma Buck and Auntie Blanche.”

He wrote that his family survived only because his relatives “were comfortable enough to write off their losses and aid us in recovering.”

Mr. Granville studied economics at Duke University and graduated in 1948. He also wrote books on bingo and investing in stamps. He was married three times.

Beside his wife, the former Karen Erickson, whom he married in 1981, he is survived by six children from his second marriage, to the former Paulina Delp — John, Blanchard, Leslie, Leona Weissman, Mary Beth and Johanna — as well as 15 grandchildren and four great-grandchildren.

Article source: http://www.nytimes.com/2013/09/19/business/joseph-e-granville-stock-market-predictor-dies-at-90.html?partner=rss&emc=rss

Nikkei Dives More Than 6 Percent

HONG KONG — The battered Japanese stock market lurched into bear market territory Thursday, after a tumble of 6.4 percent took the combined decline in the Nikkei 225 index since a peak on May 23 to more than 21 percent.

A pronounced sell-off in the morning and early afternoon accelerated shortly before the markets closed in Tokyo. The Nikkei ended down more than 840 points at 12,445.38, its lowest level since early April.

Global markets reacted badly at first, with the Euro Stoxx 50, a benchmark for euro zone blue chips, down almost 2 percent in morning trading. But European shares later recovered most of their losses, and stocks on Wall Street opened quietly after new reports showed recent improvements in the American economy.

The drop in Japan on Thursday was one of many sharp declines seen in recent weeks, since a feverish six-month rally in Japanese stocks — incited by optimism over the government’s aggressive efforts to reinvigorate the listless economy — came to an abrupt end.

The Nikkei 225 soared more than 80 percent between mid-November and mid-May, but staged a sudden about-face with a 7.3 percent plunge on May 23.

Sentiment has been fragile and trading volatile ever since, as investors have taken stock of the challenges that face “Abenomics,” the economic policies of Prime Minister Shinzo Abe, and weighed the pros and cons of taking profits after the rally.

A renewed rise in the yen also has eroded a factor that, for months, had worked to support Japanese stocks. The yen weakened substantially between November and May – a welcome development for Japanese exporters as it made their goods less expensive for customers overseas.

But the currency’s move, like that of the stock market, reversed in late May. On Thursday, the yen traded around 94.00 to the American dollar, its strongest level since early April.

In Tokyo, Yoshihide Suga, the chief cabinet secretary, brushed off the market plunge.

“I feel it’s important not to swing from joy to sorrow every time stock prices rise or fall, and keep on doing what we need to do,” Mr. Suga said at a news conference Thursday morning, as shares fell. “The Japanese economy is steadily improving.’’

The Bank of Japan governor, Haruhiko Kuroda, met with Mr. Abe on Thursday to exchange views on the economy, according to local news reports. Mr. Abe told the governor he was determined to do his part in putting a growth plan into action, Mr. Kuroda later told reporters. Mr. Kuroda told the prime minister that the central bank was committed to supporting the Japanese economy through monetary stimulus.

Mr. Kuroda also said he expected markets to soon “calm down to reflect positive developments in the economy,” according to the Nikkei Web site. On Monday, the Japanese government revised its first-quarter gross domestic product figures, saying its economy grew at an annualized pace of 4.1 percent between January and March, better than the 3.5 percent it initially reported. But that upgrade has not been enough to calm investor jitters.

Factors beyond Japan also have helped send markets lower around the world.

In China, which is a key engine of global growth, the flow of economic data in recent weeks has reinforced the picture of an economy that is struggling to regain momentum.

And in the United States, comments on May 22 by Ben S. Bernanke, the chairman of the Federal Reserve, that he and his colleagues might consider paring back their bond-buying programs “in the next few meetings” if the economy shows signs of improvement have helped fan global nervousness. Investors and analysts have struggled to assess the implications of even a small withdrawal of the bond buying that has supported markets in recent years.

In the United States, the Dow Jones industrial average and the Standard Poor’s 500-stock index have sagged 3.2 percent and 4 percent, respectively, in the past three weeks. The DAX in Germany has fallen about 4.5 percent and the CAC 40 in France has dropped more than 6 percent.

Key markets in the Asia-Pacific region have tumbled even more. The Straits Times index in Singapore and the S.P./ASX 200 in Australia have lost more than 9 percent since May 22, and in Hong Kong, the Hang Seng has shed more than 10 percent.

A pessimistic outlook issued Wednesday by the World Bank added to the gloom, with Kaushik Basu, the bank’s chief economist, noting in a news release that “the slowdown in the real economy is turning out to be unusually protracted.”

The bank, based in Washington, cut its forecast for global growth to 2.2 percent from a January forecast of 2.4 percent growth.

In explaining the revision, Mr. Basu cited high unemployment in the developed world and slower-than-expected growth in emerging economies. He also noted that India was expanding at a rate below 6 percent for the first time in a decade.

Hiroko Tabuchi contributed from Tokyo and David Jolly contributed from Paris.

Article source: http://www.nytimes.com/2013/06/14/business/global/asian-stock-markets.html?partner=rss&emc=rss

Off the Charts: Shades of Prerecession Borrowing

The amount owed on loans secured by investments rose to $384 billion at the end of April, according to data compiled by Finra, the Financial Industry Regulatory Authority. It was the first time the total had surpassed the 2007 peak of $381 billion, a peak that was followed by the Great Recession and credit crisis.

The accompanying charts show the level of outstanding margin debt since 1960, both in dollars and as a percentage of gross domestic product. The latest total of borrowing amounts to about 2.4 percent of G.D.P., a level that in the past was a danger signal.

Rising margin debt was once seen as a primary indicator of financial speculation, and the Federal Reserve controlled the amount that could be borrowed by each investor as a way to damp excess enthusiasm when markets grew frothy. But the last time the Fed adjusted the margin rules was in 1974, when it reduced the down payment required for stocks to 50 percent of the purchase price, from 65 percent. That came during a severe bear market.

Since then, the Fed has been on the sidelines. The view there, and among professional investors, has been that far greater leverage was available through options and futures, not to mention more exotic derivatives, so changing the rule would have little effect on levels of speculation.

Nonetheless, margin loans have remained popular among many individual investors, who tend to raise their borrowings during times of market optimism and to reduce them when markets are falling. Thus the margin debt levels now may provide an indication of popular enthusiasm for investments.

The first time in recent decades that total margin debt exceeded 2.25 percent of G.D.P. came at the end of 1999, amid the technology stock bubble. Margin debt fell after that bubble burst, but began to rise again during the housing boom — when anecdotal evidence said some investors were using their investments to secure loans that went for down payments on homes. That boom in margin loans also ended badly.

The charts show the changes in the Standard Poor’s index of 500 stocks during the 12 months before the margin debt level reached 2.25 percent of G.D.P., while it stayed at that level, and during the 12 months after the debt level fell below that figure. The figures are indexed to zero at the end of the first month that margin debt reached 2.25 percent of G.D.P.

In each case, there were double-digit increases in share prices during the year before margin debt got to that level. In the first two, the stock market decline began while margin debt was at the high level, and accelerated as debt levels fell — presumably because investors were liquidating securities that were losing money.

If that pattern repeats, it could indicate that the stock market rally, which carried the S. P. 500 to record levels in May, will not last much longer.

Perhaps offering some hope that pattern will not repeat is the fact share prices are lower now — at least relative to the size of the economy — than they were at the prior peaks. As it happens, the S. P. 500 was a little below 1,500 in 1999, and again in 2007, and again this past January, when margin debt rose to 2.25 percent of G.D.P. But corporate profits now are more than double what they were in 1999, according to government estimates.

Floyd Norris comments on finance and the economy at nytimes.com/economix.

Article source: http://www.nytimes.com/2013/06/01/business/economy/shades-of-prerecession-borrowing.html?partner=rss&emc=rss

Bucks: How to Get Real About Risk

Carl Richards

Carl Richards is a certified financial planner in Park City, Utah. His sketches are archived here on the Bucks blog. His new book, “The Behavior Gap,” will be out in January.

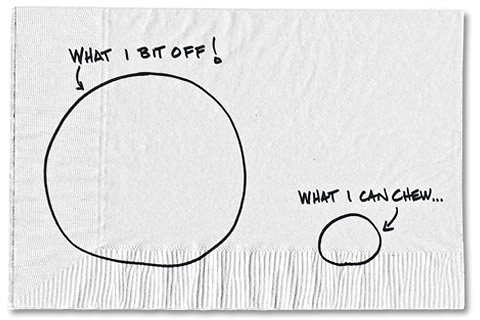
One of the most common mistakes, and certainly the most dangerous, that we make as investors is taking on more risk than we originally intended to.

The tragic story unfolding at MF Global is just the most recent very public example of a situation where things turned out to be far riskier than the people who took them initially thought. But this isn’t just a problem among aggressive traders. Each time there’s a market decline, it seems like we have to re-learn this lesson.

How often have you heard someone say they were surprised, shocked, disappointed or depressed about the fact that their investment portfolio was down during a bear market? And why are we surprised, anyway?

Bear markets are part of the normal market cycle and have been around since we started providing operating capital in exchange for fractional ownership of companies (i.e., the stock market). We shouldn’t be surprised when portfolios go down, but we still are. For some, the surprise isn’t the decline itself, but the magnitude or severity of the decline.

So why do we keep making the mistake of designing investment portfolios that are more risky than we want or need them to be?

The solution to this problem is taking the time to understand the risk associated with diversified exposure to the stock market. Then you can build a portfolio based on your unique need, willingness and ability to take on that risk.

Because this is such an individual pursuit, and every portfolio should be crafted to match your situation, following rules of thumb can be dangerous. But everyone needs a starting point, so here are a few things to get you thinking:

1. Accept that there is no reward without risk.

Risk and return are related. I’m talking about responsible, diversified risk, not stupid, thoughtless risk. Owning one individual stock is a stupid risk. Taking huge bets on distressed European sovereign debt is another stupid risk. But owning a diversified basket of index funds? That’s responsible, diversified risk. See the difference?

After building a plan to meet your goals, you may determine that you need, and are willing, to have a portion of your money invested in the stock market. Because of the historical returns, you’re willing to live with the risk. And that risk is the high probability that the market will go down temporarily as part of a long, upward march.

I’ve often heard it said that the primary risk to owning stocks is that you’ll get scared out of them at the wrong time. One of the key implications of this idea is that there is no way to own equities without taking on the risk. So give up on the idea that you can time the market. There is no one that stands ready to ring a bell before the market goes down.

If you understand this and believe it, it’s actually a very freeing concept. Design a portfolio to match your goals and your ability to take the risk. Rebalance it periodically to match your original plan design, and live your life.

2. Practice a lifeboat drill.

The great thing with investing, and our investing behavior, is that the numbers don’t lie. After all we have records of this stuff.

So here’s an exercise that can help. Pull out your tax returns and investing statements. Review your investment behavior over the last 12 or so years. Did you buy technology stocks in 1999? Did you get out of the market in 2002? Did you become a “real estate investor” in 2006 or 2007? Did you go to cash in early 2009?

Reviewing behavior can tell us a lot about how we feel about risk. If we made the classic mistakes of buying high and selling low over and over again, clearly it’s time to consider a portfolio that won’t be vulnerable to our own mood swings.

3. Review economic and stock market history.

This suggestion needn’t be painful or boring, particularly if you recognize the benefits of understanding the history of investing and cycles. There’s been serious debate recently about the value of history to investing. But we have a choice: we can either choose to make important decisions with our life savings while ignoring history, or we can make those important decisions with the benefit of the weighty evidence of history.

Even if you tell yourself that “this time is different,” there are still lessons to be learned from history that can help avoid poor decisions. Go back and look at the major declines in the stock market. Look at the early 1970s. Read the history of Black Friday. Review what happened in 1999 and then the decline that followed.

The major lesson from these events is that while periods of incredible pessimism and panic get most of the headlines, things have a way of working out. It turns out that rational optimism has been the correct view of the world for the last hundred years. It would seem to be a reasonable assumption that it will continue.

This short-term panic and pessimism hasn’t turned out to be the right outlook for the long term, so why let it keep you awake at night? We usually find ways to work through the underlying problems, and chances are high we will again. Yes, we face serious problems, but we have faced serious problems in the past.

So now, let’s apply this thinking to our investment portfolios. Building a broadly diversified portfolio that matches your need, ability, and desire to take risk, then holding onto it, has been the correct way to build wealth in the past. It seems reasonable to assume that the same will hold true in the future.

Certainly we will be surprised again in the future, as we have in the past, about the timing, nature, and cause of major market turmoil. But we shouldn’t be surprised that it happens. And that fact should play a major role in how we design our investment portfolios.

Hat tip to @slarkpope whose own similar sketch from several months ago inspired mine this week.


Article source: http://feeds.nytimes.com/click.phdo?i=6de6206713edc0c86731a93a0d4bcc99

Global Markets Jump on Europe’s Greek Debt Deal

 While the deal helped to restore confidence to the financial markets, analysts noted that questions remained about how it would be implemented. They also worried that fully fixing the problems of excessive debt and weak growth could take years.

Still, after days of anticipation, the markets put whatever uncertainties remained behind them, at least for now. Financial stocks in particular were up more than 6 percent.

The Dow Jones industrial average soared 339.51 points to close up 2.86 percent at 12,208.55, while the broader Standard Poor’s 500 index was up even more, 3.43 percent, at 1,284.56 and the Nasdaq composite index rose 3.32 percent to 2,738.63.

 The S.P. moved into positive territory for the year on Thursday, up about 2.1  percent. The Dow was up more than 5 percent and the Nasdaq more than 3 percent for the year.

Stocks closed up as much as 6 percent in Europe, after a strong showing in Asia.

It was a marked turn-around from just a few weeks ago, when anxiety over the European debt crisis helped push Wall Street to the brink of a bear market. On Oct. 3, the S.P. 500 was down 19.4 percent from its high on April 29.

The latest news from Europe came early Thursday, when officials from the European Union and the International Monetary Fund reached a deal with bankers to write down the face value of their Greek debt by 50 percent, hoping to reduce the ratio of the country’s debt to gross domestic product to 120 percent by 2020. Economists believe that is essential if Greece is not to default on its loans.

Officials also agreed that European banks would need to raise more capital and said they would increase the euro zone bailout fund to $1.4 trillion, a move that they hope will provide the capacity necessary to keep Italy and Spain from following Greece’s painful path.

“The most important outcome is it seems to remove from the table fears of an imminent bank crisis,” said David Joy, chief market strategist for Ameriprise Financial. “What this does is it buys Europe time to do the hard work of initiating structural reforms.”

But like others, he injected a note of caution: “It addresses the symptoms, but not the disease. They need to follow through, there is no question.”

Economists noted that the deal Thursday was but the latest in a series of such agreements addressing the debt crisis, which are usually followed by gains, then losses in the financial markets.

After the last deal was struck in July, for example, stocks and bonds in Europe and the United States gave it a positive reception. But the sentiment soon turned and markets failed to sustain their gains. The S.P. in the United States fell below 1,300 after about a week. and eventually sank to its lowest level for the year.

“Overall, then, while the plans represent a step forward, we suspect that they will soon be viewed in the same way as every other policy response during this crisis — as too little, too late,” Jonathan Loynes, an economist with Capital Economics, wrote in a research note.

He said he still expected a “prolonged recession in the euro zone,” further market turbulence, and continued to have doubts about the future of the euro itself “in its current form.”

The Euro Stoxx 50 index, a barometer of euro zone blue chips, closed up 6.1 percent, while the FTSE 100 index in London gained 2.9 percent. In Paris, the main index was up 6.3 percent, while Frankfurt’s was 5.35 percent higher.

Financial shares led European indexes.

The United States 10-year Treasury bond yield rose to 2.37 percent, from 2.21 percent on Wednesday.

The dollar fell against most major currencies. The euro rose to $1.42 from $1.39 late Wednesday in New York, while the British pound rose to $1.61 from $1.5975. The dollar also fell to 75.8 yen from 76.17 yen, and to 0.86 Swiss franc from 0.88 franc.

Anthony Valeri, a fixed income investment strategist for LPL Financial, said that the European deal, to an extent, removed one of the lingering risks to the market and more specifically, to the banking system.

“But the devil is in the details,” he added. “There are some implementation risks going forward.”

He said there were questions about participation in increasing the bailout fund.

“We don’t know the participation from private investors or the emerging market countries, as the case may be,” he said.

Another negative was that banks must meet a new core capital ratio of 9 percent by the middle of 2012, he added. That could mean they could either raise capital or shed assets, which would be a negative for the market because of the pressure on prices.

In Asia, shares were stronger almost across the board. The Tokyo benchmark Nikkei 225 stock average rose 2 percent, the Sydney market index S.P./ASX 200 rose 2.5 percent, and Hong Kong’s Hang Seng index rose 3.3 percent.

“Bank recapitalization, haircuts and more firepower for the rescue funds are supposed to form a euro-style bazooka,” Carsten Brzeski, an economist with ING in Brussels, said in a research note. “Even if there are still loose ends and unsolved questions, yesterday’s summit was an important step in the right direction.”

Shortly after the deal was announced, United States crude oil futures for December delivery rose 2.8 percent to $92.71 a barrel. Comex gold futures slipped were mostly unchanged, at $1,723.40 an ounce.

Bond market movements showed investors moving out of the securities considered the most secure and into riskier assets.

The Federal Reserve on Thursday is starting a bond buy-back measure that will bump up prices on long-term notes, Mr. Valeri said.

Bond prices for embattled euro zone governments rose sharply, while the yields fell. The yield on Greek 10-year bonds was 22.16 percent, down 1.17 percentage points. Spanish and Italian bond yields also fell.

David Jolly reported from Paris.

Article source: http://feeds.nytimes.com/click.phdo?i=09c7dbb3afeec1789b72a157854fbade

Euro and S&P Futures Firm on G20; Asian Stocks Are Weak

Finance ministers and central bankers from the Group of 20 said they would take “all steps necessary” to calm the global financial system and said central banks were ready to provide liquidity, helping the euro advance against the dollar.

The G20 pledge of action provided a respite for world stocks after they tumbled to their lowest level in 13 months on Thursday, hurt by the risk of new recessions in the United States and Europe and weaker economic data from China.

Metals prices bucked the trend, falling on worries that the gloomy economic outlook signaled lower industrial demand, and analysts said any G20-inspired market bounce would likely be short-lived.

The pan-European FTSEurofirst 300 index rose 0.4 percent, after dropping 4.7 percent on Thursday.

“It is a relief rally and investors are just picking up some stocks on the cheap,” Mark Priest, senior trader at ETX Capital said.

“I do not see how everything has changed overnight. Kick-starting the economy is easier said than done and it will take a lot more than what has been put on the table.”

The tentative gains in Europe contrasted with falls in Asia, where the MSCI’s broadest index of Asia Pacific shares outside Japan fell 3 percent to its lowest level since May 2010. This pulled the MSCI world equity index 0.1 percent down.

The G20 statement came as finance ministers and central bankers met in Washington, under pressure from investors to show action in the face of rising stresses in the financial system.

Several European banks have seen their share prices tumble and their cost of funding rise as investors worried about their exposure to debt issued by Greece and other debt-heavy euro zone countries.

Global stocks as measured by MSCI’s All-Country World index are now in bear market territory — defined as a fall of 20 percent or more — having fallen 23 percent from their 2011 high in May.

The euro clawed off an 8-month low against the dollar and was last up 0.4 percent up at $1.3511 after the G20 pledge and as the tentative recovery in riskier assets prompted some profit-taking in the dollar.

The G20 also said the euro zone’s rescue fund could be bolstered but traders and strategists said there was little that was new and the pledges needed to be followed up with action.

“I think there was some expectation in the market that they would signal concrete action or immediate coordinated steps but that language of their statement sticks very much to what we’ve heard from them in the past,” said Todd Elmer, a currency strategist at Citi in Singapore.

“I wouldn’t be surprised to see the slight bounce we have seen in the euro and other risky assets this morning start to unwind,” he added.

Commodity markets, copper in particular, bore the brunt of the global rout that accompanied the Fed’s gloomy outlook. Brent crude oil futures posted their biggest single-day loss in six weeks on Thursday and the Reuters-Jefferies CRB commodity index lost 4.4 percent.

Metals fell further on Friday, with copper losing 7 percent to $7,140 a metric ton, nickel down more than 8 percent and tin plunging more than 12 percent.

Brent futures were slightly firmer at $105.72 a barrel.

(Additional reporting by Alex Richardson and Masayuki Kitano in Singapore, Atul Prakash in London; Editing by John Stonestreet)

Article source: http://www.nytimes.com/reuters/2011/09/22/business/business-us-markets-global.html?partner=rss&emc=rss

Fundamentally: The Worry Meter May Overlook Some Warning Signs

So can investors calm down?

Unfortunately, the answer is no. The problem with traditional volatility gauges is that they’ve never been great predictors of future market activity. For example, the Chicago Board Options Exchange Volatility Index, or VIX, which measures fear based on Standard Poor’s 500 options contracts that are used to hedge volatility, was near its historical average and showed no worrisome rise in jitters on Oct. 9, 2007, at the start of the last bear market.

In fact, it wasn’t until November of that year, when stocks had already lost 10 percent of their value, that the VIX started flashing a warning sign, climbing to a reading of 30 — about twice the average.

“We know that huge shocks in the market can trigger large movements in the VIX,” said Jason Hsu, chief investment officer at Research Affiliates, an investment consulting firm in Newport Beach, Calif. “But it’s not clear that nervousness in the stock market can be picked up in the VIX before big movements in the market are felt.”

The same goes for another gauge of market skittishness — one that tracks fear by tallying the number of trading days when stock prices swing — up or down — by 1 percent or more.

By this standard, market fear is virtually nonexistent today, as the S. P. 500-stock index is on track this year to post 25 days of such 1 percent moves, according to InvesTech Market Research. That’s down from 76 days last year, 117 in 2009, and 134 in 2008.

But investors shouldn’t necessarily assume that smooth sailing is ahead.

Sam Stovall, chief investment strategist for S. P. Equity Research, studied days when the market had lost at least 1 percent of its value, going back to 1956. He found that in the final three months of bull markets, the S. P. 500 has only 5.7 such down days, on average. Yet in the three months after a new bear market begins, that number nearly doubles, to 11.

“A pickup in volatility seems to be more of a coincident indicator than a leading one,” Mr. Stovall said. Or, as I’d put it, volatility isn’t a problem until it becomes a problem. Still, this doesn’t mean that classic gauges of market jitters are worthless in analyzing risk. In fact, volatility gauges can be useful to bulls and bears alike.

Market optimists, for example, can take comfort in knowing that volatility readings tend to jump at big transitional moments in the market when there’s a great debate as to the general direction of stocks and the economy.

That may be why the biggest rise in volatility tends to take place in the first year of a new bull or bear market, when it’s hard for market participants to tell that a shift has even taken place. In the first year of a new bull market, for example, the market averages 29 days when losses exceed 1 percent, according to S. P. But in second years, that figure falls to 16. And in the third year of a rally, it drops to 11.

Mr. Hsu argues that there are plenty of reasons for investors to be worried these days — among them, slowing corporate earnings growth and continuing, tough fiscal challenges among governments worldwide. But the lack of a meaningful rise in volatility would seem to indicate that investors for the most part agree that we’re in store for a slowdown, and not another recession and bear market.

“This is more of a sign of lowered expectations, not a double dip,” he said.

Nevertheless, bearish investors would do well to keep tabs on volatility, market strategists say.

That’s because volatility can be a contrarian indicator. Indeed, “some of the most dangerous periods for the market have come when volatility was at its lowest,” said James B. Stack, editor of the InvesTech Market Analyst newsletter. “That’s when you have the most widespread sense of complacency in the market.”

A perfect example of this was in 2007, when the financial crisis was just starting and the VIX hovered between 16 and 18, about where it is today.

TIMOTHY W. HAYES, chief investment strategist at Ned Davis Research, said that the “time to be concerned is when volatility readings really start to pick up at the same time you see the market breaking down.”

So far, investors have witnessed half of that combination, as stocks have lost around 7 percent of their value since late April.

If selling should continue as volatility starts to climb, investors may really need to worry.

Paul J. Lim is a senior editor at Money magazine. E-mail: fund@nytimes.com.

Article source: http://feeds.nytimes.com/click.phdo?i=9ac42971cb2eed47ac0c64dea1bfaadc

Fundamentally: A Bounce Isn’t Enough to Recover From a Bubble

DESPITE recent volatility in global markets, domestic stocks have doubled in value in the last two years, the fastest such gain since the Great Depression.

And financial shares have fared even better, soaring more than 160 percent since the long stock rally began in March 2009.

But will the broad market in general and financial stocks in particular resume this torrid pace? Perhaps not.

Consider how stocks have fared over a much longer stretch — since the end of the previous bull market, in March 2000. Last Thursday was the 11th anniversary of the bursting of the technology bubble, a reminder of how long it may take investments at the center of a major market plunge to return to their past glory.

For example, though most sectors of the Standard Poor’s 500-stock index are now trading above their levels of March 2000, the overall index is still slightly below where it was then. And technology and telecommunications stocks — the market’s best performers leading up to the 2000-02 bear market — are still down around 60 percent, on average, from their peaks 11 years ago; blue-chip growth stocks are off about 35 percent.

What’s the moral of this story? Don’t count on a complete recovery anytime soon, said Sam Stovall, chief investment strategist at Standard Poor’s Equity Research. “It could take 15 years for stocks to work off the effects of a major bubble,” he said.

Mr. Stovall has studied market recovery periods in the years after World War II. He has found that while it usually takes stocks about 14 months to return to previous highs after a mild bear market, and five years, on average, to bounce back from a severe downturn of 40 percent or more, it typically takes even longer to recover from a bubble.

He noted, for example, that after oil prices peaked during the energy bubble in 1980, it took 16 years for some categories of oil-related stocks to recover to their pre-bubble highs. And after gold peaked in 1980 at around $850 an ounce, it took 28 years for the price to return to their pre-bust perch. (Of course, even at $1,426 an ounce, gold still hasn’t recovered to its 1980 levels when adjusted for inflation.)

The reason that recoveries take so long “is that a true bubble occurs only when valuations are taken to extremes, and it usually requires at least two bear markets to bring those valuations back to historic norms,” said James B. Stack, editor of the InvesTech Market Analyst newsletter.

To be sure, one could argue that the valuations of financial shares have never skyrocketed the way those of tech shares did in the late 1990s.

In fact, at the end of 2007, when the global credit bubble had popped, the price-to-earnings ratio for financial stocks stood at around 17, according to Bloomberg. That’s about on par with valuations for the broad market at the time.

Yet that happened because the reported profits of financial companies had soared leading up to the plunge, Mr. Stack said, so that earnings — the “E” in the P/E ratio — generally kept pace with rising prices.

“But in reality,” he said, “many of those earnings were built on artificial sources of income that were not only going to dry up but reversed course when the asset bubble popped.”

Another reason to believe that financials may soon hit a ceiling, Mr. Stack said, is that “there are still too many people waiting to get out” of those shares. In other words, many investors are still holding onto financial stocks not out of faith, but because those shares are still so far below their October 2007 peaks — about 50 percent, on average — that they’ve have been waiting for a bigger rally before selling.

Haven’t financials surged over the last two years? Yes. But Jack A. Ablin, chief investment officer at Harris Private Bank, notes that since the first three months of this rally — when financial stocks bounced back the most — these shares have actually lagged behind the broad market. Since the start of June 2009, the S. P. 500 has gained 42 percent, versus just 34 percent for the financial stocks in the index.

Mr. Ablin said that “conditions during this stretch couldn’t have been any better for the banks,” alluding to the government’s efforts to keep short-term interest rates near zero, assuring substantial profits when banks relend that money to customers. “Yet this is all we got to show for it,” he said. “That would suggest that it could take many years for the fundamentals of this sector to recover.”

AS for the broad market, it’s hard to imagine how much longer it can keep up the pace of the last two years, some market strategists say.

Beyond the threat of rising inflation, as well as various geopolitical risks, valuations are becoming stretched. David R. Kotok, chief investment officer at Cumberland Advisors, says a simple way to judge the frothiness of the market is to consider the ratio of total domestic stock market capitalization to gross domestic product. “History says that when stock market capitalization is about 55 percent or 60 percent of G.D.P., stocks are a great bargain, which was the case during the March 2009 lows,” Mr. Kotok said. “But when stocks are 110 percent of G.D.P., it’s time to sell.”

Today, the stock market is worth about 95 percent of G.D.P. “So,” he said, “I don’t believe the market has a large strategic move upward from here in the short term.”

Paul J. Lim is a senior editor at Money magazine. E-mail: fund@nytimes.com.

Article source: http://feeds.nytimes.com/click.phdo?i=20516d56cb02a670c4261331533e387f