April 18, 2024

Off the Charts: U.S. Companies Thrive as Workers Fall Behind

The major change in the latest comprehensive revision of the national income and product accounts — known as NIPA to statistics aficionados — is to treat research and development spending as an investment, similar to the way the purchase of a new machine tool would be treated by a manufacturer, rather than as an expense. That investment is then written down over a number of years.

The result is to make the size of the economy, the gross domestic product, look bigger, and to appear to be growing faster, in years when new research spending is greater than the amount being written down from previous years. For the same reason, corporate profits also look better in those years.

A lot of money is spent on research and development. Nicole Mayerhauser, the chief of the national income and wealth division of the Bureau of Economic Analysis, which compiles the figures, said that in 2012 the total was $418 billion, about one-third of which was spent by governments. That amounted to about 2.6 percent of G.D.P.

The other major conceptual change deals with pensions. Until now, corporate and government contributions to pension plans were counted as personal income only when the contributions were made. Under the revision, the government estimates how much should have been contributed to meet the promises made to workers, and counts that amount, whether it is higher or lower than the amount actually put into the pension plan. That causes personal income to appear larger in years when pension contributions are lower than they should be.

The revised numbers also reflect some better information as new data becomes available. Ms. Mayerhauser said that it now appeared that in recent years the government might have overestimated the amount of income that went unreported by taxpayers, including the amounts of unreported tips received by restaurant employees. Revising those figures down meant that workers as a group appeared to be doing even worse than they had appeared to be doing.

And that was none too well. Before the figures were revised, it appeared that wages and salary income in 2012 amounted to 44 percent of G.D.P., the lowest at any time since 1929, which is as far back as the data goes.

But the revisions cut that to 42.6 percent, which matched the revised 2010 figure as the lowest ever.

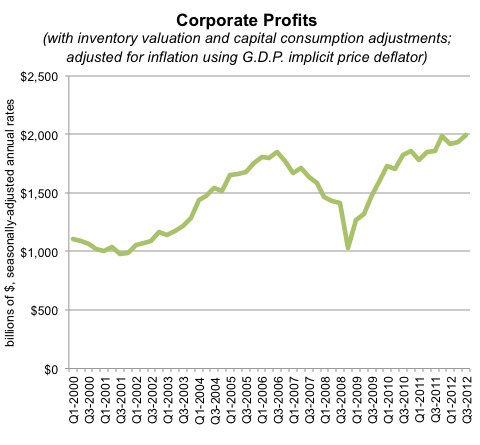
The flip side of that is that corporate profits after taxes amounted to a record 9.7 percent of G.D.P. Each of the last three years has been higher than the earlier record high, of 9.1 percent, which was set in 1929.

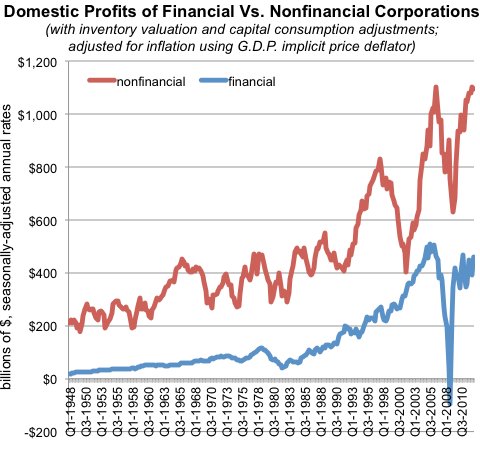
The charts help to demonstrate how the postrecession economy differs from the one before the downturn. In the three years from 2005 through 2007, the share of G.D.P. going to corporate profits was 1.5 percentage points lower than it was during the years 2010 through 2012. The share going to workers was 1.1 percentage points higher during the earlier years.

Corporate taxes, as a proportion of corporate profits, rose to a four-year high of 21.6 percent in 2012, but remained well below the long-term average level. Personal taxes also hit a four-year high, at 14.1 percent of personal income, but were still well below the historical average.

Floyd Norris comments on finance and the economy at nytimes.com/economix.

Article source: http://www.nytimes.com/2013/08/10/business/economy/us-companies-thrive-as-workers-fall-behind.html?partner=rss&emc=rss

Strategies: Elastic Numbers Make It Hard to Get a Handle on the Economy

A TORRENT of economic numbers rained down from Washington last week. They provided a sharper historical perspective on the economy back to 1929.

Yet the deluge of statistics did little to clarify an urgent question: How strong is the economy right now?

It’s a basic issue — one that affects the life of every American, the policy decisions of the Federal Reserve, the strategies of businesses and the performance of the markets. Unfortunately, the answer is by no means clear.

There are plenty of fresh numbers, though. On Friday morning, the Labor Department said the unemployment rate dropped in July to 7.4 percent, from 7.6 percent the previous month, and a total of 162,000 new nonfarm payroll jobs were created.

This is good news, but perhaps not as good as it seems. Even at 7.4 percent, unemployment remains uncomfortably high, and the government on Friday also revised downward job creation numbers for the previous two months, from 195,000 per month, to 176,000 for May and 188,000 for June. The Fed, acknowledging things are not as good as they could be four years after a major recession, reaffirmed its loose monetary policy. That policy, based on the assumption that the economy still needs emergency support, has helped hold interest rates to relatively low levels, and helped propel the stock market to new highs last week.

Gross domestic product numbers released on Wednesday also suggested that the economy was still ailing. In the second quarter of 2013, the Bureau of Economic Analysis said, the growth rate of G.D.P. was 1.7 percent, on a seasonally adjusted, annualized basis. That’s just a preliminary number, subject to extensive revision. For the first quarter, the bureau now says G.D.P. grew at a 1.1 percent rate — after a series of reductions from its initial estimate of 2.5 percent.

But how weak is the economy? The numbers don’t appear to fit a coherent pattern. Even with the downward revisions in the labor figures, the current level of job creation is greater than would typically be expected from a weak economy. The lackluster G.D.P. picture is hard to reconcile with the decline in the unemployment rate we’ve been seeing, said Joseph G. Carson, director of global economic research at AllianceBernstein. “During similar tepid growth environments in the past, unemployment has sometimes even increased rather than declined,” he said.

Something’s wrong with the numbers. “Growth in the private sector, which has been running at 3.3 percent, probably helps to explain the drop in the jobless rate,” he said. He believes the overall G.D.P. figures aren’t yet really capturing reality and that it’s likely that G.D.P. growth over the last two years has actually been stronger than reported. Mr. Carson is optimistic about the second half of this year. “I think the economy will be picking up, and the numbers will start to show that.”

The numbers are remarkably malleable, as the Bureau of Economic Analysis demonstrated last week.

In addition to the normal range of monthly and weekly economic reports, the bureau issued an ambitious revision of its statistics, adjusting a vast range of figures going back more than 80 years. Its revision showed that the recent recession was a little less severe than earlier reported, and the recovery has been a bit stronger. The economy shrank at an average annual pace of 2.9 percent, not 3.2 percent, in the recession that started in December 2007 and ended in June 2009. And from the recession’s end through 2012, the economy grew at an average annual rate of 2.2 percent, not 2.1 percent as previously published.

Those numbers would still classify the recession as the worst since World War II, and the recovery as the weakest. Further revisions will be made as needed, and, given the anomalies in the current data, it seemed likely that some future changes will be significant. Ben S. Bernanke, the Fed chairman, alluded to this possibility in Congressional testimony last month.

“We all should keep in mind that these are very rough estimates and they get revised,” Mr. Bernanke said. “For example, you get somewhat different numbers when you look at gross domestic income instead of gross domestic product.”

IN theory, G.D.I. and G.D.P. should be equal. One measures gross income, the other gross production, and as a matter of basic accounting they ought to match. But they don’t, not in real time, because they are collected from different sources using different deadlines and definitions. G.D.P., for example, depends heavily on sales receipts, while G.D.I. relies on data from paychecks, which are often issued well after sales are made, said J. Steven Landefeld, director of the bureau. “G.D.I. and G.D.P. are both the bureau’s children,” he said. “We’re proud of both, and we know they’re different.”

Early G.D.I. numbers have provided a better indicator of cyclical changes in the economy — of the onset and the end of the last recession, in particular — than have early readings of G.D.P., according to research by Jeremy J. Nalewaik, a Fed economist.

What are the G.D.I. numbers telling us now? It depends on how you look at them. The Economic Cycle Research Institute, an independent forecaster, said that the economy fell into another recession “sometime in the middle of 2012 and it is still in a recession now,” according to Lakshman Achuthan, the institute’s chief operations officer. He relied in part on G.D.I. data. But the vast majority of mainstream economists reject this interpretation, and Mr. Landefeld said G.D.I. numbers might sometimes exaggerate economic trends.

The G.D.P. and G.D.I. numbers available right now indicate that the economy is growing, but Mr. Achuthan said that the historical revisions made last week “are a reminder that these numbers are all a moving target, and that they will change.”

Mr. Carson of AllianceBernstein is far more sanguine, saying the economy appears to be growing modestly. But he agrees that the data isn’t allowing clear visibility. “We’ve gotten so many new numbers,” he said. “They help a bit. Now the past has become a little less foggy, but as for the present, there’s still plenty of fog to go around.”

Article source: http://www.nytimes.com/2013/08/04/your-money/elastic-numbers-make-it-hard-to-get-a-handle-on-the-economy.html?partner=rss&emc=rss

Economix Blog: Record Corporate Profits

CATHERINE RAMPELL

CATHERINE RAMPELL

Dollars to doughnuts.

United States corporate profits reached a record high in the third quarter of this year, even adjusted for inflation, according to a report from the Bureau of Economic Analysis.

Source: Bureau of Economic Analysis via Haver Analytics. Source: Bureau of Economic Analysis via Haver Analytics.

The increase from the second quarter was entirely a result of stronger business at home. Profits received from American-owned businesses abroad fell slightly in the third quarter, which may not be surprising given the recession in Europe and the slowdown in China.

Additionally, all of the growth in domestic corporate profits was accounted for by the financial sector.

Domestic profits of financial corporations rose $71.3 billion in the third quarter, after falling $39.7 billion in the second. Domestic profits of nonfinancial corporations, on the other hand, decreased $1 billion in the third quarter, after rising $27.8 billion in the second quarter.

Source: Bureau of Economic Analysis, via Haver Analytics. Source: Bureau of Economic Analysis, via Haver Analytics.

Article source: http://economix.blogs.nytimes.com/2012/11/29/record-corporate-profits/?partner=rss&emc=rss

Economix Blog: Casey B. Mulligan: The iPhone and Consumer Spending

DESCRIPTION

Casey B. Mulligan is an economics professor at the University of Chicago.

That the introduction of iPhone 5 increases consumer spending is no triumph for Keynesian economics, but merely an advertisement for plans by the Bureau of Economic Analysis to improve national accounting.

Today’s Economist

Perspectives from expert contributors.

Suppose there were an island economy with 100 able-bodied adults, all of whom work as fisherman, each catching a fish a day. The 100 fish are eaten by the island people, which makes inflation-adjusted daily consumer spending in the economy – or consumption, as economists call it – equal to 100.

(In order to clarify concepts and measurement practices, I have deliberately kept this model economy simple, with no unemployment, liquidity traps and the like.)

Now suppose that 10 of the fisherman decide to quit fishing to build, nurture and tend to an apple orchard. In the beginning, the orchard produces no apples, so consumer spending drops to 90 fish a day, because only 90 adults are out fishing while the other 10 are developing an orchard.

Time passes, and a bountiful 100-apple harvest occurs. Because the apples taste good, the island fishermen obtain all 100 apples from 10 orchard owners in exchange for fish. The apple harvest has by itself boosted consumption in the economy, which suddenly jumped from 90 fish a day to 90 fish a day plus 100 apples.

It would be ridiculous to proclaim that the apple harvest and its effect on consumer spending prove that the economy is plagued by a liquidity trap, or to insist that the immediate effect of the harvest on consumer spending is independent of the quality of the apples. By construction, this model economy has no Keynesian features, yet nonetheless a harvest has a large effect on measured consumption.

Consider now the American economy, in which Apple has just released its iPhone 5, and some economists say they believe that the release itself will noticeably increase aggregate consumer spending. Paul Krugman has gone even further, to assert that the increase is a proof for Keynesian economics and that the “short-run benefits from the new phone have almost nothing to do with how good it is.

Even if Keynesian economics were completely wrong, economists would expect the iPhone 5 release to cause consumer spending and gross domestic product to be greater than it was before the release, to a degree related to the phone’s overall value to consumers. Note that, as in my island economy, the development of Apple products reduces consumption before the release, because the people working on the coming products are not available to produce consumer goods during that time.

Much of the development work on the iPhone 5 did not, before its release, count as investment or G.D.P. (G.D.P. is the sum of public and private consumption and public and private investment). The national accounts treat research and development activities as intermediate inputs, which means that they are subtracted from revenue for the purpose of determining a corporation’s contribution to national production.

This same is true for, say, Apple’s legal expenses in developing patents (many of which are discussed on the Mactech Web site) and license terms for their new product.

These development activities appear as G.D.P. only when the product is completed and sold. If the product is not valuable, it will not sell and will not count for much, although national consumption could still rise if upon project completion the developers move out of development and into the production of consumer goods.

(Research and development employees usually receive wages during the development phase, but their prerelease compensation comes out of corporate profits).

For the purposes of understanding the timing of economic activity, the national accounts’ treatment of research and development is a weakness, because it recognizes the developers’ activity at the wrong time – only after the product is released. Economists at the Bureau of Economic Analysis (the agency producing our nation’s accounts) are aware of this weakness, how it has become acute with the rise of the technology sector and steps they might take to improve the accounts. They are doing the best they can with the data and economic research results that are available.

Measured consumption rises in the quarter when people buy their new iPhones, not when they actually use them (in my island model, the consumption would be measured when the apples are bought, not when they are eaten). IPhones are durable goods that are used for years after Apple sells them as new, including by second and third owners.

Curiously, the timing of measured iPhone consumption would be markedly different if Apple or cellular carriers had chosen to rent the phones rather than sell them, because the measured consumption would occur each month when users paid their rental fees (the Bureau of Economic Analysis is aware of this weakness and rectifies it in sectors where it is most acute, like the housing sector).

The iPhone 5 release is no occasion to cheer for wasteful government spending, but perhaps does help make the case for a larger budget at the Bureau of Economic Analysis, so that it can continue its progress on measuring the amount and timing of economic activity.

Article source: http://economix.blogs.nytimes.com/2012/09/19/the-iphone-and-consumer-spending/?partner=rss&emc=rss

Economix Blog: A Second Great Depression, or Worse?

DESCRIPTION

Simon Johnson, the former chief economist at the International Monetary Fund, is the co-author of “13 Bankers.”

With the United States and European economies having slowed markedly according to the latest data, and with global growth continuing to disappoint, a reasonable question increasingly arises: Are we in another Great Depression?

Today’s Economist

Perspectives from expert contributors.

The easy answer is “no” — the main features of the Great Depression have not yet manifested themselves and still seem unlikely. But it is increasingly likely that we will find ourselves in the midst of something nearly as traumatic, a long slump of the kind seen with some regularity in the 19th century, particularly if presidential election-year politics continue to head in a dangerous direction.

The Great Depression had three main characteristics, seen in the United States and most other countries that were severely affected. None of these have been part of our collective experience since 2007.

First, output dropped sharply after 1929, by over 25 percent in real terms in the United States (using the Bureau of Economic Analysis data, from its Web site, for real gross domestic product, using chained 1937 dollars). In contrast, the United States had a relatively small decline in G.D.P. after the latest boom peaked. According to the bureau’s most recent online data, G.D.P. peaked in the second quarter of 2008 at $14.4155 trillion and bottomed out in the second quarter of 2009 at $13.8541 trillion, a decline of about 4 percent.

Second, unemployment rose above 20 percent in the United States during the 1930s and stayed there. In the latest downturn, we experienced record job losses for the postwar United States, with around eight million jobs lost. But unemployment only briefly touched 10 percent (in the fourth quarter of 2009; see the Bureau of Labor Statistics Web site).

Even by the highest estimates — which include people discouraged from looking for a job, thus not registered as unemployed — the jobless rate reached around 16 to 17 percent. It’s a jobs disaster, to be sure, but not the same scale as the Great Depression.

Third, in the 1930s the credit system shrank sharply. In large part this is because banks failed in an uncontrolled manner — largely in panics that led retail depositors to take out their funds. The creation of the Federal Deposit Insurance Corporation put an end to that kind of run and, despite everything, the agency has continued to play a calming role. (I’m on the F.D.I.C.’s newly created systemic resolution advisory committee, but I don’t have anything to do with how the agency handles small and medium-size banks.)

But the experience at the end of the 19th century was also quite different from the 1930s — not as horrendous, yet very traumatic for many Americans. The heavily leveraged sector more than 100 years ago was not housing but rather agriculture — a different play on real estate.

There were booming new technologies in that day, including the stories we know well about the rapid development of transportation, telephones, electricity and steel. But falling agricultural prices kept getting in the way for many Americans. With large debt burdens, farmers were vulnerable to deflation (a lower price level in general or just for their products). And before the big migration into cities, farmers were a mainstay of consumption.

According to the National Bureau of Economic Research, falling from peak to trough in each cycle took 11 months between 1945 and 2009 but twice that length of time between 1854 and 1919. The longest decline on record, according to this methodology, was not during the 1930s but rather from October 1873 to March 1879, more than five years of economic decline.

In this context, it is quite striking — and deeply alarming — to hear a prominent Republican presidential candidate attack Ben Bernanke, the Federal Reserve chairman, for his efforts to prevent deflation. Specifically, Gov. Rick Perry of Texas said earlier this week, referring to Mr. Bernanke: “If this guy prints more money between now and the election, I don’t know what y’all would do to him in Iowa but we would treat him pretty ugly down in Texas. Printing more money to play politics at this particular time in American history is almost treacherous — er, treasonous, in my opinion.”

In the 19th century the agricultural sector, particularly in the West, favored higher prices and effectively looser monetary policy. This was the background for William Jennings Bryan’s famous “Cross of Gold” speech in 1896; the “gold” to which he referred was the gold standard, the bastion of hard money — and tendency toward deflation — favored by the East Coast financial establishment.

Populism in the 19th century was, broadly speaking, from the left. But now the rising populists are from the right of the political spectrum, and they seem intent on intimidating monetary policy makers into inaction. We see this push both on the campaign trail and on Capitol Hill — for example, in interactions between the House Financial Services Committee, where Representative Ron Paul of Texas is chairman of the monetary policy subcommittee, and the Federal Reserve.

The relative decline of agriculture and the rise of industry and services over a century ago were long believed to have made the economy more stable, as it moved away from cycles based on the weather and global swings in supply and demand for commodities. But financial development creates its own vulnerability as more people have access to credit for their personal and business decisions. Add to that the rise of a financial sector that has proved brilliant at extracting subsidies that protect against downside risk, and hence encourage excessive risk-taking. The result is an economy that is at least as prone to big boom-bust cycles as what existed at the end of the 19th century.

The rise of the Tea Party has taken fiscal policy off the table as a potential countercyclical instrument; the next fiscal moves will be contractionary (probably more spending cuts), whether jobs start to come back or not. In this situation, monetary policy matters a great deal, and Mr. Bernanke’s focus on avoiding deflation and hence limiting the problems for debtors does not seem inappropriate (for more on Mr. Bernanke, his motivations and actions, see David Wessel’s book, “In Fed We Trust“).

Mr. Bernanke has his flaws, to be sure. Under his leadership, the Fed has been reluctant to take on regulatory issues, continuing to see the incentive distortions of “too big to fail” banks as somehow separate from monetary policy, its primary concern. And his team has consistently pushed for capital requirements that are too low relative to the shocks we now face.

And the Federal Reserve itself is to blame for some of the damage to its reputation, although it did get a major assist from Treasury in 2008-9. There were too many bailouts rushed over weekends, with terms that were too generous to incumbent management and not sufficiently advantageous to the public purse.

But to accuse Mr. Bernanke of treason for worrying about deflation is worse than dangerous politics. It risks returning us to the long slump of the late 1870s.

Article source: http://feeds.nytimes.com/click.phdo?i=73500819e37f339b4b4e30239c3f500f

Economix: Still Playing Catch-Up

Given that the downturn began nearly four years ago, and that the population has grown significantly since then, the economy should instead be bigger than it was before the financial crisis. But Calculated Risk, a finance blog, makes a good observation: On most major measures of economic health, the economy is still worse today than it was before the recession began.

CATHERINE RAMPELL

CATHERINE RAMPELL

Dollars to doughnuts.

Here’s a chart I’ve put together showing the percentage changes in several important economic indicators since the start of the recession in December 2007. The categories are: overall economic growth (gross domestic product), jobs (nonfarm payrolls), personal income (without transfer payments from the government, like unemployment benefits), the length of the workweek, personal spending, and industrial production.

Source: Bureau of Labor Statistics, Federal Reserve, Bureau of Economic Analysis, all via Haver Analytics

As you can see, all of these categories but one are still below where they were when the recession began. Industrial production is by far the worst off, since an index of this activity is nearly 8 percent below its level in December 2007. Second-worst is employment; today there are 5 percent — or about seven million — fewer payroll jobs than there were when the recession began.

Inflation-adjusted personal income and gross domestic product are still below the last business cycle peak, as is the average work week.

The one major indicator shown that is (barely) above its level at the start of the recession is inflation-adjusted consumer spending. Much of that growth has been subsidized by government transfer payments, however. And to further rain on this parade, remember that if the economy were healthy, consumer spending would probably be much higher today than it was before the recent recession. Just take a look at the longer-term trend:

Source: Federal Reserve Bank of St. LouisFigures on left axis are expressed in “chained” dollars — inflation-adjusted, in 2005 dollars.

Article source: http://feeds.nytimes.com/click.phdo?i=3cb3379491255cf19144e88efffae5ae